
Journal of Development Research

 Search

Dipendra Karki1  , Niranjan Devkota2, Rewan Kumar Dahal1, Suresh Kumar Upreti3 and Binod Ghimire1
1Faculty of Management, Tribhuvan University, Kirtipur, Bagmati, Nepal
2Kathmandu Model College, Kathmandu, Bagmati, Nepal
3Pokhara University, Pokhara, Gandaki, Nepal

Creative Commons Non Commercial CC BY-NC: This article is distributed under the terms of the Creative Commons Attribution-NonCommercial 4.0 License (http://www.creativecommons.org/licenses/by-nc/4.0/) which permits non-Commercial use, reproduction and distribution of the work without further permission provided the original work is attributed.
This research examines the effectiveness of mutual fund (MF) operations in Nepal’s financial market, specifically analysing how these investment vehicles aggregate capital from varied investor portfolios to optimise smaller fund management strategies. The investigation spans a 4-year period, examining five distinct funds through comprehensive performance measurement techniques. The analysis incorporates multiple evaluation criteria, including market performance benchmarks, Treynor’s risk-adjusted ratio, Sharpe’s reward-to-volatility measure and Jensen’s alpha coefficient to assess fund efficiency. The findings reveal that fund operational expenses and maturity period (fund age) emerge as the primary determinants influencing performance outcomes, demonstrating statistically significant associations (p < .05). Conversely, total asset size and fund liquidity demonstrate negligible influence on performance metrics. The evaluation demonstrates that each examined fund successfully exceeds market benchmark performance, with Sanima Equity Fund (SAEF) achieving superior results across measured parameters, whereas Laxmi Equity Fund (LEMF) demonstrates comparatively weaker performance indicators. This investigation provides significant contributions to investment decision-making by revealing the operational characteristics and performance patterns within Nepal’s MF sector.
Market return, mutual funds, performance evaluation, Sharpe ratio, stock market,
Introduction
The contemporary global financial ecosystem has witnessed a pronounced shift in investor preferences toward developing economies during the recent decades, primarily motivated by prospects of greater yields and portfolio diversification advantages (Ratner & Leal, 2005). This trend emphasises the critical importance of these markets in diversifying portfolios and in spreading investment risk globally, particularly in emerging markets where mutual funds (MFs) have shown distinctive performance characteristics (Samarbakhsh & Shah, 2021). These financial instruments, distinguished by their mechanism of consolidating capital from heterogeneous investor groups for deployment across diverse security portfolios, provide individual participants with access to professionally supervised investment strategies (Chua & Tam, 2020). This research investigates the multiple dynamics that influence MF performance in Nepal.
The 18th century marked the inception of MFs, which have since evolved to include both closed and open-ended funds. A landmark achievement in this evolution occurred with the formation of the Massachusetts Investment Trust in America during 1924, which introduced the revolutionary principle of ongoing unit creation and redemption mechanisms (Baker et al., 2015). This developmental journey demonstrates the worldwide importance of these investment mechanisms, which have become fundamental components of investor portfolios, delivering professional management of diversified holdings encompassing equities, fixed-income securities and alternative investments.
The equities fund industry grew significantly after the global financial crisis of 2008, with a noteworthy annual compound yield rate of 6.64% till 2018, owing to digitalisation and innovations (Bhandari et al., 2021; Carneiro et al., 2022; Huang & Chang, 2022). This asset accumulation demonstrates the increasing importance of collective investment vehicles within international financial systems. Nepal’s developing MF sector continues to grow and adapt, despite global disruptions like the COVID-19 pandemic, which had notable impacts on money-market fund operations in developing economies (Samarbakhsh & Shah, 2021). Nepal’s MF sector began with the founding of the ‘Nepal Capital Market (NCM) MF in 1993’ (Thapa & Rana, 2011). Though collective investment fund schemes are gaining attraction in the Nepalese market, there remains a notable research gap in their performance analysis in the domestic setting (Pant et al., 2022). The context of a volatile international financial landscape and the distinctive characteristics of Nepalese collective investment schemes establish the foundation for a thorough evaluation of performance dynamics within Nepal’s MF sector. This work fills a crucial knowledge gap by conducting a thorough empirical evaluation of the performance characteristics of Nepalese MFs, driven by their growing importance in the country.
In achieving the primary aim of evaluating Nepalese MF performance, this study establishes three distinct objectives that specifically acknowledge and address the particular characteristics of the domestic market environment. Initially, the study seeks to examine yield generation by MFs and benchmark it against market indices while accounting for corresponding risk factors; subsequently, to investigate the comprehensive effectiveness of Nepal’s collective investment schemes; and finally, to establish the statistical validity of MF performance measures. Given Nepal’s unique market environment, there is a clear need to explore the functioning of collective investment schemes in greater depth. This study not only addresses key research questions but also offers practical value for the country’s evolving MF industry. By providing actionable insights for portfolio managers, the research bridges academic understanding with real-world application. Its structured analysis supports both theoretical development and informed decision-making for investors and professionals in the sector.
The structure of the article is organised as follows: Section ‘Review of Literature’ reviews related literature to establish the study’s context. Section ‘Research Methodology’ outlines the research methodology, emphasising the empirical framework. Section ‘Results and Analysis’ reports the main findings from the analysis. Section ‘Discussion’ discusses the results and their broader implications. Finally, Section ‘Conclusion’ offers concluding observations.
Review of Literature
The MF industry has experienced notable growth in recent decades, prompting increased academic interest in evaluating fund performance. Typically, fund performance serves as a proxy for assessing fund manager capability. Since the 1960s, both practitioners and scholars have explored price prediction and performance analysis using various risk-return metrics and valuation models (Karki, 2017).
Treynor (1965) introduced a reward-to-volatility metric that accounts for both risk and return.Shortly after, Sharpe (1966) proposed an alternative measure—reward-to-variability—based on the ratio of excess returns to standard deviation (SD). Building upon these, Jensen (1968) developed his alpha model, which calculates excess return adjusted for systematic risk, grounded in the Capital Asset Pricing Model (CAPM). These three approaches remain foundational in evaluating MF performance, despite their retrospective nature.
Sharpe (1966) further refined Treynor’s framework by incorporating composite indicators. His study, covering 34 US open-end funds from 1944 to 1963, found that average fund returns lagged behind the Dow Jones Industrial Average (DJIA). Jensen’s (1968) alpha metric also emphasised risk-adjusted performance, showing that none of the 115 evaluated funds consistently outperformed the market. Dahal et al. (2020) and Elton et al. (2004) stress the significance of considering specific benchmarks and accounting metrics, warning that their exclusion could inflate performance estimates.
McDonald (1974) analysed 123 funds using monthly data from 1960 to 1969, employing several measures including Jensen’s alpha, Sharpe and Treynor ratios, and non-risk-adjusted returns. The findings again indicated underperformance relative to the market. Collectively, these studies advanced the development of more nuanced methods for performance evaluation.
Numerous investigations have provided comprehensive perspectives on MF performance, covering diverse geographical regions and methodological approaches. Recent research highlights how machine learning models are transforming MF performance prediction (Boonprasope & Tippayawong, 2024; DeMiguel et al., 2023). In Pakistan, Alvi and Rehan (2020) explored factors like risk levels, lag returns, Karachi Stock Exchange (KSE)-100 index returns, assets under management (AUM), fund age, income and expenses. Asad and Siddiqui (2019) considered macroeconomic and microeconomic variables, finding limited influence from size and maturity on performance across conventional and Islamic funds. Building on this, collective investment fund performance contributes positively to overall stock market development, which in turn leads to improvements in key macroeconomic indicators, supporting the view that MFs act as financial intermediaries that enhance capital market efficiency and economic growth, consistent with the long-run cointegrated relationships identified between financial and economic variables (Karki, 2012, 2018). Additionally, sustainable investing has become increasingly relevant, with evidence suggesting that institutional investors significantly drive corporate sustainability practices, which indirectly influence MF flows and performance (Kräussl et al., 2023; Marti et al., 2023).
In India, Adhikari et al. (2020) applied ‘Sharpe, Treynor and Jensen’s methods over a 10-year horizon, finding that most equity-oriented funds outperformed the market. Likewise, Raj et al. (2018) compared State Bank of India (SBI) and Housing Development Finance Corporation (HDFC) funds using standard metrics, concluding that while HDFC delivered better returns, it exhibited higher volatility. Dhanda (2017) used net asset value (NAV) data over 14 years, showing that sector-focused funds often beat benchmarks. Similarly, Radhika and Kanchana (2017) found strong performance in several HDFC schemes, while Megharaja (2017) attributed superior returns to effective security selection by fund managers.
Arora and Raman (2020) highlighted variance in return and risk across 30 randomly selected schemes. In Nepal, Bajracharya (2016) and Rauniyar (2016) both identified liquidity, lagged returns and asset base as critical drivers of fund performance. Ferreira et al. (2013), covering 19 countries, found a positive link between fund size and performance. In Pakistan, Nafees et al. (2011) showed that MFs underperformed relative to the market, while Rehman and Baloch (2015) revealed that expense ratios, turnover and fund size had significant positive impacts. Globally, recent studies affirm that expense ratios are still a reliable predictor of returns (DeMiguel et al., 2023; Li & Rossi, 2021).
A notable research gap persists in Nepal, where most studies have focused narrowly on risk-adjusted returns, with limited exploration of determinants such as fund manager skill in security selection. This study addresses that gap by investigating key performance factors using established risk-adjusted models and presents a conceptual framework (Figure 1) aligned with its objectives.
The conceptual framework for this study comprises fundamental factors, including expense ratios, fund age, AUM, liquidity, returns and NAV for performance evaluation of MFs. It forms the basis for developing hypotheses that guide empirical analysis specific to Nepal’s context.
Figure 1. Conceptual Framework.
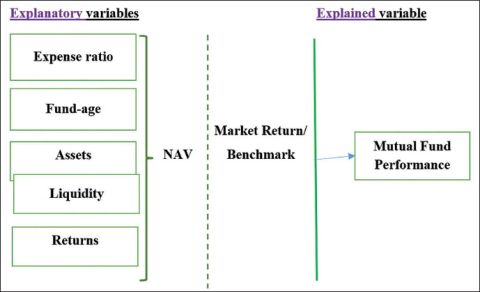
H1: There is no significant relationship between fund attributes (expense ratio, age, assets, liquidity and return) and MF performance.
H2: There is no significant relationship between NAV return and MF performance.
H3: MF performance exceeds benchmark returns.
H4: The Nepalese stock market is efficient in its weak form.
These hypotheses aim to clarify how various fund characteristics impact performance, offering a clear path for empirical validation.
Research Methodology
This research adopts a causal-comparative and descriptive methodology to examine fund manager performance, selected due to its exploratory and data-analysis strengths in MF performance assessment. Secondary data analysis forms the foundation of this research approach.
Population and Sample Size Determination
This investigation analyses five MFs, selecting five schemes from 29 operational plans during the research timeframe. Monthly data, including liquidity metrics, asset values, fund maturity, expense ratios, NAVs and performance returns, were gathered via the Nepal Stock Exchange (NEPSE) source and sample MF companies. The examination concentrated on schemes operating for more than 4 years, accumulating NAV values over 48 months spanning January 2018 through January 2022 (see Table 1).
Table 1. Selected Mutual Fund Schemes for Analysis.
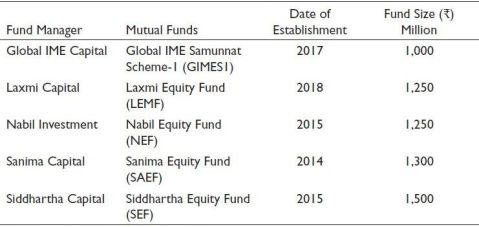
Source: NEPSE and sample mutual funds.
Data Analysis Methods
MF performance was assessed using Sharpe (1966), Treynor (1965) and Jensen (1968) measures, based on the CAPM framework. The main analytical approaches are as follows.
NAV Returns. It represents the differential between organisational asset values and net obligations, functioning as an MF performance indicator.

Where NAV1 and NAV2 represent values at two different time points.
Sharpe Ratio. The Sharpe index serves as a ‘risk-adjusted performance indicator’ commonly utilised for portfolio evaluation. This metric evaluates portfolio comprehensive risk through SD rather than focusing exclusively on systematic risk components (βs).
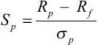 (1)
(1)
Where Sp is the Sharpe ratio, Rp is the average rate of return for a fund, Rf is the average risk-free return and σp is the SD of the fund. Superior portfolio performance (Sp) compared to market performance (Sm) indicates enhanced fund effectiveness, and conversely.
Treynor Ratio. The Treynor index evaluates risk premiums against return volatility, measured through portfolio systematic risk components (βs). It calculates additional returns per systematic risk (β) unit. This enhanced portfolio performance (Tp) relative to market performance (Tm) demonstrates superior fund effectiveness and vice versa. The approach assumes diversified multi-asset portfolios eliminate unsystematic risks, retaining only systematic risk (beta). The computation follows:
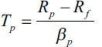 (2)
(2)
Where Tp is the Treynor Ratio, Rp is the average rate of return for a fund, Rf is the average risk-free return and βp is the beta of the fund. Enhanced portfolio performance (Tp) compared to market performance (Tm) demonstrates superior fund effectiveness and vice versa.
Jensen Alpha Test. Jensen alpha quantifies the variance between realised portfolio returns and theoretically expected returns, given a particular systematic risk exposure level. This measurement framework builds upon CAPM theoretical foundations. The computational formula for ‘Jensen’s alpha determination follows’:
 (3)
(3)
Where αp represents Jensen alpha, Rp indicates fund average returns and EARp denotes equilibrium average returns. The equilibrium average return (EARp) = Rf + βp (Rm – Rf), where Rf represents average risk-free return, βp indicates fund beta and Rm denotes market index returns. Enhanced alpha values signify improved fund performance through superior returns.
Jensen’s (1968) absolute performance measurement methodology was utilised for fund selection assessment within the CAPM analytical frameworks. This approach employs regression analysis, examining relationships between fund excess returns and market excess returns. The Jensen alpha (α) constitutes the regression intercept, representing the mean returns when the market portfolio performance equals zero. Through the ‘single beta regression methodology (4), statistically significant positive α values demonstrate superior stock selection capabilities and performance exceeding benchmark standards’, whereas negative α values indicate inadequate stock selection practices.
 (4)
(4)
Where Rpt represents portfolio returns at month t, Rmt indicates benchmark returns at month t, Rft denotes risk-free returns at month t, α represents the Jensen performance metric and βp indicates fund systematic risk. Therefore, positively significant alpha (α) values represent excess mean returns achieved beyond benchmark returns, considering funds’ systematic risk levels. This shows the special capability of a fund manager in security price prediction and stock selection. Future studies investigating alternative methods to behavioural frameworks could provide more comprehensive examinations, emphasising additional factors affecting MF performance (Bhattarai et al., 2024; Devkota et al., 2023).
Results and Analysis
To comprehensively understand MF performance dynamics, this investigation employed quantitative analytical frameworks and diverse statistical methodologies.
Performance Classification and Ranking
Initially, the investigation assessed and classified five MFs using key performance metrics, demonstrating strengths and weaknesses regarding their respective competencies and weaknesses. Classifications follow the ascending order of fund assets, operational months (maturity), expense ratios, liquidity, NAV and returns. Funds with the highest assets, operational months (maturity), liquidity, NAV and returns receive first ranking, and conversely. However, regarding expense ratios, funds having the lowest expense ratios receive top classification. Table 2 illustrates classification details.
‘Siddhartha Equity Fund (SEF)’ achieved superior performance, obtaining the top overall classification through the highest asset values, continuous operation of 51 months, exceptional liquidity and robust returns. ‘Sanima Equity Fund (SAEF)’, though representing the newest fund with merely 2 months of operational history, demonstrated exceptional performance by achieving maximum return rates of 30.02%. ‘Nabil Equity Fund (NEF)’ obtained third position, exhibiting balanced performance across diverse parameters, including moderate asset holdings of 1.25 billion rupees ($9.62 million). Conversely, ‘Global IME Sammunat Scheme-1 (GIMES1)’ showed better cost management through low expense ratios (1.26%) but underperformed in liquidity and asset value, resulting in poor classification. ‘Laxmi Equity Fund (LEMF)’ achieved the poorest overall classification, predominantly impacted by relatively lower values of assets and moderate rates of return (5.29%).
Descriptive Assessment
Table 3 presents a descriptive study of MF characteristics and market index (NEPSE) performance.
Table 2. Comparative Classification of Five Mutual Funds by Performance Measures.
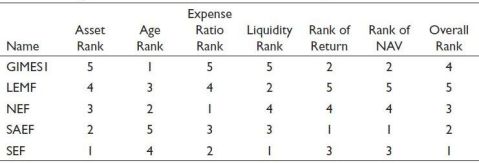
Note: GIMES1: Global IME Sammunat Scheme-1; LEMF: Laxmi Equity Fund; NAV: Net asset value; NEF: Nabil Equity Fund; SAEF: Sanima Equity Fund; SEF: Siddhartha Equity Fund.
Table 3. Statistical Summary of Performance Measures.
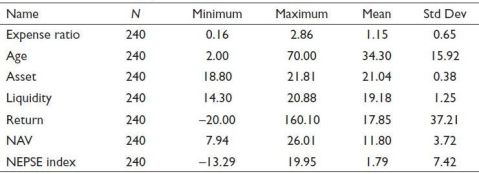
Note: NAV: Net asset value; NEPSE: Nepal Stock Exchange.
Mean logarithmic asset holdings achieved 21.04, demonstrating considerable funds on every scheme. Effective cost control resulted in mean expense ratios of 1.15, with GIMES1 standing out for its low ratio. Average fund maturity was 34.30 months, with a remarkable SD of 15.92, emphasising establishment period variations. MFs demonstrated average returns of 17.85%, showing significant variability (SD: 37.21). SEF’s constantly higher returns serve to improve overall fund performance. The NEPSE index mirrored market conditions with average returns of 1.79%, highlighting fluctuating market characteristics.
Table 4, demonstrating performance evaluation of five sample MFs throughout the study period from 15th January 2018 to 14th January 2022, indicates significant insights regarding their performance and volatility patterns. SAEF tops with an outstanding average monthly return of 30.02%, fluctuating between a minimum of −4.20% and a maximum of 127.30%, with a SD of 39.73%. GIMES1 comes next, achieving average monthly returns of 22.69%, with broader ranges of −20.60% to 160.10%, and a SD of 53.79%. Comparatively, SEF’s average monthly return is 19.62%, NEF’s is 11.63% and LEMF’s is 5.29%. NAVs vary across funds, with SAEF maintaining the highest NAV of ₹13. Furthermore, during the study period, monthly average returns for all funds reached 17.85%, exceeding NEPSE index average returns of 1.79%. This extensive outperformance emphasises MF effectiveness in yielding investor excess returns, placing them as lucrative investment alternatives. Table 4 also presents the statistical significance of sample fund mean returns, emphasised through simultaneous t-values (p < .05) of selected funds for evaluating their performance robustness. Evidence from the table indicates that, excluding LEMF, all funds succeed in generating significantly positive mean returns (p < .05) to investors compared to market index performance.
Inferential Analysis
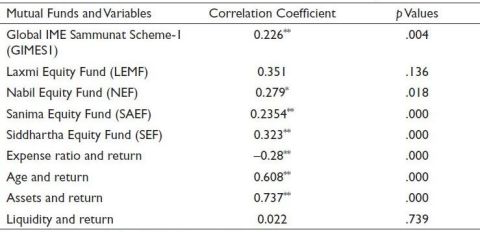
This section investigates the interrelationship between the MFs and market index returns in Nepal, as shown by correlation coefficients illustrated in Table 5. The positive correlation coefficients, spanning from 0.226 to 0.351, suggest consistent positive associations between fund returns and market performance. While most coefficients remain below 0.5, indicating moderate relationships, it remains essential to recognise that these correlation characteristics contribute meaningfully to understanding fund responsiveness to market fluctuations.
Table 4. Descriptive Summary of Sample Funds and Nepal Stock Exchange (NEPSE).
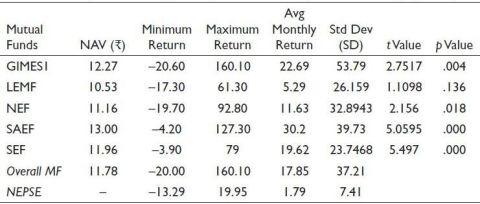
Note: GIMES1: Global IME Sammunat Scheme-1; LEMF: Laxmi Equity Fund; MF: Mutual fund; NAV: Net asset value; NEF: Nabil Equity Fund; SAEF: Sanima Equity Fund; SEF: Siddhartha Equity Fund.
Table 5. Correlation between Fund Returns, Market-index and Study Variables.
Note: **Significant at 1% level; * Significant at 5% level..
Among the funds analysed, LEMF shows the highest correlation (0.351) with market return, although the p value (.136) indicates that this relationship lacks statistical significance. In contrast, funds such as GIMES1, NEF, SAEF and SEF exhibit statistically meaningful associations, as evidenced by their p values below .05, confirming the relevance of market performance in shaping fund returns.
When broadening the scope to other influencing variables, strong positive relationships emerge between fund size (assets) and returns (r = 0.737), and between fund age and returns (r = 0.608). Conversely, the expense ratio demonstrates a significant negative correlation (r = −0.280), suggesting that higher operational costs diminish returns. Liquidity, however, appears to have a negligible connection with returns (r = 0.022), and its insignificance is statistically confirmed.
Performance Measurement Indicators
Performance assessment findings on Nepalese MFs reveal impressive patterns, illustrated in Table 6 with fundamental measures—‘Sharpe, Treynor and Jensen ratios’. These measurements function as reliable metrics, evaluating investment vehicles against benchmarks to establish their risk-adjusted return capabilities.
The Sharpe Ratio values for all funds are positive, indicating outperformance relative to the market’s negative risk-return trade-off. SEF and SAEF lead this category, confirming strong returns per unit of volatility, as supported by prior global findings (Malhotra & Nippani, 2024; Yuan & Yuan, 2023). In terms of the Treynor Ratio, which assesses returns relative to market risk (beta), SAEF again arises as the best performer with a ratio of 21.902, showcasing its efficiency in generating returns in proportion to market risk. Jensen’s alpha results reaffirm these rankings, with SAEF displaying the highest excess return (28.50%) beyond what would be predicted by market trends. Despite ranking last, LEMF still reflects a positive alpha, confirming that it has contributed positively after adjusting for risk.
Analysis of Variance (ANOVA) and Post-hoc Comparisons
To test for statistically significant differences in average returns across funds, a one-way ANOVA was conducted. The output, presented in Table 7, indicates significant variations among group means.
Post-hoc tests using the Bonferroni correction (α = 0.005) showed significant differences in return means, particularly for LEMF in comparison with SAEF (p = .0004) and SEF (p = .0036). These statistically significant contrasts suggest distinct return patterns for LEMF versus its peers. Meanwhile, comparisons among other fund pairs do not reveal significant differences, highlighting more homogenous performance levels within those groups.
Table 6. Performance Indicators of Selected Mutual Funds.
.jpg/10_1177_22297561251365992-table6(1)__480x163.jpg)
Note: GIMES1: Global IME Sammunat Scheme-1; LEMF: Laxmi Equity Fund; NEF: Nabil Equity Fund; SAEF: Sanima Equity Fund; SEF: Siddhartha Equity Fund.
Table 7. Analysis of Variance (ANOVA) and Post-hoc Comparison of Fund Returns.
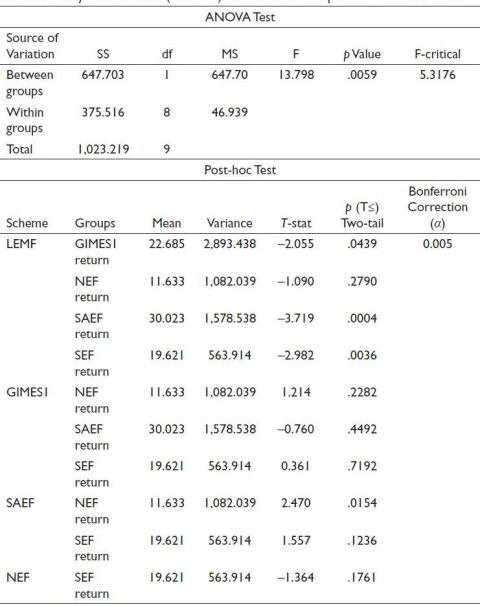
Note: GIMES1: Global IME Sammunat Scheme-1; LEMF: Laxmi Equity Fund; NEF: Nabil Equity Fund; SAEF: Sanima Equity Fund; SEF: Siddhartha Equity Fund; SS: Sum of Squares; df – Degrees of Freedom; MS- Mean Square; F- F-statistic.
Discussion
This comprehensive examination of Nepal’s MF sector and the evaluated investment schemes provides significant insights regarding their operational effectiveness. The descriptive analysis demonstrates that monthly performance figures exceed those of the NEPSE benchmark, while correlation studies indicate moderately positive links between fund returns and overall market performance. Of particular interest, the LEMF demonstrates an absence of meaningful correlation with market movements, which diverges from Wermers’ (2000) research findings and suggests fund-specific characteristics unique to this context. The correlation coefficients demonstrate statistically significant positive relationships connecting fund assets with market performance, and fund maturity with market returns, whereas a negative association exists between expense ratios and market performance, suggesting potential detrimental effects on fund efficiency. These statistically meaningful associations (p < .05) challenge the initial hypotheses, H1 and H2, which predicted substantial connections between fund characteristics and performance outcomes. The findings support Wermers’ (2000) conclusions while contradicting research by Otten and Bams (2002), underscoring the dynamic characteristics of these correlations.
ANOVA testing demonstrates meaningful variations in average returns across the examined funds. Subsequent Bonferroni post-hoc testing underscores the unique position of LEMF, showing substantial differences compared to other investment vehicles. Correlation examination reveals meaningful associations and considerable differences, with SEF demonstrating the most statistically significant correlation coefficient (0.323), supporting findings from Alvi and Rehan (2020) and Bajracharya (2016). Investigation of relationships between predictor variables and market performance reveals important mean variations. Positive mean variations between fund assets and market performance indicate modest influence, whereas negative mean variations between expense ratios and market performance underscore the inverse relationship, consistent with Philpot et al. (1998) and Jan and Hung (2003). Positive mean variations between fund maturity and market performance support Ferreira et al. (2013) findings, confirming a beneficial relationship. The negligible positive effect of liquidity on returns, aligned with Asad and Siddiqui (2019), demonstrates the limited influence of liquidity factors on fund performance.
Extending beyond simple correlations, risk-adjusted performance indicators, including Treynor metrics, Sharpe measures and Jensen alpha, demonstrate favourable performance outcomes. SEF, SAEF and GIMES1 demonstrate leadership in Sharpe ratio performance, supporting hypothesis H3 and confirming their ability to generate enhanced returns relative to risk exposure. Notably, LEMF demonstrates weaker performance, suggesting a possible risk-return imbalance. The Treynor metric confirms superior performance, with SAEF demonstrating leading efficiency. Jensen’s alpha measurements further confirm fund outperformance, positioning the SAEF at the forefront, consistent with existing literature. ANOVA results confirm overall statistical significance, with post-hoc testing revealing specific intra-group variations. LEMF distinguishes itself through significant variations from other funds, reinforcing performance-influencing factors. Regarding performance rankings, SAEF, SEF and NEF establish themselves as leading performers across multiple evaluation criteria. In contrast, LEMF and GIMES1 achieve lower performance rankings. The findings demonstrate that MFs surpass market benchmark performance, indicating both superior management capabilities and the substantial impact of investor behaviour on fund flows and performance (Boonprasope & Tippayawong, 2024). This superior performance also corresponds with recent studies indicating that developing equity markets may contain inefficiencies that competent fund managers can leverage to create additional returns (DeMiguel et al., 2023; Karki, 2020; Li & Rossi, 2021). This finding refutes hypothesis H4, suggesting that Nepal’s equity market does not exhibit weak-form efficiency.
Conclusion
This study evaluates the MF sector in Nepal, providing key insights into how fund-specific features and market dynamics interact to shape performance. Using a set of statistical and risk-adjusted metrics, the research identifies ‘SAEF and SEF as the most efficient schemes, based on variables such as fund size, cost efficiency, fundage and rate of return’. The superior Sharpe, Treynor and Jensen alpha metrics underscore the consistent ability of these funds to outperform market benchmarks, despite operating in an emerging financial system characterised by low literacy, thin market depth and regulatory constraints. While ‘LEMF and GIMES1’ receive relatively weaker assessments in overall performance, they still contribute positively to certain areas. To improve investor confidence and fund viability, the study recommends enhanced regulatory support, strategic investor education and the development of innovative fund structures. Looking forward, the MF sector holds promise for deepening capital markets and mobilising domestic savings. Further research may consider incorporating behavioural factors and market microstructure variables to better predict fund performance in evolving economies.
Acknowledgements
The facilities provided by the Kathmandu University School of Management contribute to the quality of this work. The authors are grateful to them.
Declaration of Conflicting Interests
The authors declared no potential conflicts of interest with respect to the research, authorship and/or publication of this article.
Ethical Approval
Ethical approval was obtained from the relevant ethics committee or Institutional Review Board (IRB).
Funding
The authors disclosed receipt of the following financial support for the research, authorship and/or publication of this article: The University Grants Commission, Nepal, provided financial support for this study under UGC Award Number: PhD-77/78-Mgmt-01.
ORCID iDs
Dipendra Karki https://orcid.org/0000-0001-9045-7423
Niranjan Devkota https://orcid.org/0000-0001-9989-0397
Rewan Kumar Dahal https://orcid.org/0000-0002-1629-3720
Adhikari, K., Dey, N. B., & Mazumder, M. A. (2020). Performance of equity oriented mutual funds schemes in India: An analysis. International Journal of Research in Commerce & Management, 11(10), 1–23.
Alvi, J., & Rehan, M. (2020). Factors affecting mutual fund performance in Pakistan. Global Journal of Business, Economics and Management: Current Issues, 10(2), 124–143. https://doi.org/10.18844/gjbem.v10i2.4907
Arora, R., & Raman, T. V. (2020). A study on performance evaluation of equity mutual funds schemes in India. International Journal of Financial Engineering, 7(2), 2050017. https://doi.org/10.1142/S2424786320500176
Asad, M., & Siddiqui, D. A. (2019). Determinants of mutual fund performance in Pakistan. International Journal of Social and Administrative Sciences, 4(2), 85–107. https://doi.org/10.18488/journal.136.2019.42.85.107
Bajracharya, R. B. (2016). Mutual fund performance in Nepalese mutual fund units: An analysis of monthly returns. Journal of Advanced Academic Research, 3(2), 92–100.
Baker, H. K., Filbeck, G., & Kiymaz, H. (2015). Mutual funds and exchange-traded funds: Building blocks to wealth. Financial Markets and Investments. https://doi.org/10.1093/acprof:oso/9780190207434.001.0001
Bhandari, U., Jaisi, T., Devkota, N., Karki, D., Adhikari, D. B., Paudel, U. R., & Parajuli, S. (2021). Retail loan under interest rate fluctuation in Nepal: Customers interest, challenges, and managerial solutions. Journal of Asian Business Strategy, 11(1), 46–54. https://doi.org/10.18488/journal.1006.2021.111.46.54
Bhattarai, G., Budhathoki, P. B., Rai, B., & Karki, D. (2024). Detrimental impact of employees’ job demand on their workplace incivility behaviour: Restorative role of self-efficacy. International Journal of Management and Sustainability, 13(1), 26–39. https://doi.org/10.18488/11.v13i1.3593
Boonprasope, A., & Tippayawong, K. Y. (2024). Predicting healthcare mutual fund performance using deep learning and linear regression. International Journal of Financial Studies, 12(1), 23. https://doi.org/10.3390/ijfs12010023
Carneiro, L. M., Eid, J. W., & Yoshinaga, C. E. (2022). The implications of passive investments for active fund management: International evidence. Global Finance Journal, 53, 100623. https://doi.org/10.1016/j.gfj.2021.100623
Chua, A. K., & Tam, O. (2020). The shrouded business of style drift in active mutual funds. Journal of Corporate Finance, 64, 101667. https://doi.org/10.1016/j.jcorpfin.2020.101667
Dahal, R. K., Bhattarai, G., & Karki, D. (2020). Management accounting practices on organizational performance mediated by rationalized managerial decisions. International Research Journal of Management Science, 5(1), 148–169. https://doi.org/10.3126/irjms.v5i1.35870
DeMiguel, V., Gill-Bazo, J., Nogales, F. J., & Santosm A. A. P. (2023). Machine learning and fund characteristics help to select mutual funds with positive alpha. Journal of Financial Economics, 150(3), 103737. https://doi.org/10.1016/j.jfineco.2023.103737
Devkota, N., Kumari, A., Upretee, S., Basyal, D. K., Mahato, S., Karki, D., Paudel, U. R., Parajuli, S., & Dhakal, K. (2023). Farmers’ perspectives on sugarcane management in Nepal: Empirical evidence from logistic regression model. Journal of Agriculture and Crops, 9(2), 222–232. https://doi.org/10.32861/jac.92.222.232
Dhanda, N. (2017). Performance evaluation of selected mutual fund growth schemes in India. EPRA International Journal of Economic and Business Review, 5(5), 89–95.
Elton, E. J., Gruber, M. J., & Busse, J. A. (2004). Are investors rational? Choices among index funds. The Journal of Finance, 59(1), 261–288. https://doi.org/10.1111/j.1540-6261.2004.00633.x
Ferreira, M. A., Keswani, A., Miguel, A.F., & Ramos, S. B. (2013). The determinants of mutual fund performance: A cross-country study. Review of Finance, 17(2), 483–525. https://doi.org/10.1093/rof/rfs0
Huang, C. L., & Chang, Y. C. (2022). Growth impact of equity market crises: A global perspective. International Review of Economics & Finance, 78, 153–178. https://doi.org/10.1016/j.iref.2021.11.004
Jan, Y. C., & Hung, M. W. (2003). Mutual fund attributes and performance. Financial Services Review, 12(2), 165–178.
Jensen, M. (1968). The performance of mutual fund in the period 1945–1964. Journal of Finance, 23(2), 389–416. https://doi.org/10.2307/2325404
Karki, D. (2012). Economic impact of tourism in Nepal’s economy using cointegration and error correction model (pp. 1–12). ResearchGate. https://www.researchgate.net/publication/276027809, http://doi.org/10.13140/RG.2.1.4839.5684
Karki, D. (2017). Structural equation modeling of latent variables affecting stock prices: Evidence from Nepal. Tribhuvan University Journal, 31(1–2), 25–44. https://doi.org/10.3126/tuj.v31i1-2.25329
Karki, D. (2018). The dynamic relationship between tourism and economy: Evidence from Nepal. Journal of Business and Management, 5(1), 16–22. https://doi.org/10.3126/jbm.v5i0.27384
Karki, D. (2020). The stock market’s reaction to unanticipated catastrophic event. Journal of Business and Social Sciences Research, 5(2), 77–90. https://doi.org/10.3126/jbssr.v5i2.35236
Kräussl, R., Oladiran, T., & Stefanova, D. (2023). A review on ESG investing: Investors’ expectations, beliefs and perceptions. Journal of Economic Surveys, 38(2), 476–502. https://doi.org/10.1111/joes.12599
Li, B., & Rossi, A. G. (2021). Selecting mutual funds from the stocks they hold: A machine learning approach. SSRN Journal, 1–71. https://papers.ssrn.com/sol3/papers.cfm?abstract_id=3737667
Malhotra, D., & Nippani, S. (2024). Assessing energy mutual funds: Performance, risks, and managerial skills. International Journal of Financial Studies, 12(1), 20. https://doi.org/10.3390/ijfs12010020
Marti, E., Fuchs, M., DesJardine, M. R., Slager, R., & Gond, J. (2023). The impact of sustainable investing: A multidisciplinary review. Journal of Management Studies, 61(5), 2181–2211. https://doi.org/10.1111/joms.12957
McDonald, J. G. (1974). Objectives and performance of mutual funds, 1960–1969. The Journal of Financial and Quantitative Analysis, 9(3), 311–333. https://doi.org/10.2307/2329866
Megharaja, B. (2017). Performance evaluation of equity mutual fund in India with special reference to sector funds. International Journal of Commerce and Management Research, 3, 52–157.
Nafees, B., Shah, S. M. A., & Khan, S. (2011). Performance evaluation of open-end and closed-end mutual funds in Pakistan. African Journal of Business Management, 5(28), 11425. https://academicjournals.org/journal/AJBM/article-full-text-pdf/24B2D5F18261
Otten, R., & Bams, D. (2002). European mutual fund performance. European Financial Management, 8(1), 75–101. https://doi.org/10.1111/1468-036X.00177
Pant, R., Ghimire, B., & Dahal, R. K. (2022). Determinants of mutual fund performance in Nepal. Nepal Journal of Multidisciplinary Research, 5(5), 1–16. https://doi.org/10.3126/njmr.v5i5.51798
Philpot, J., Hearth, D., Rimbey, J. N., & Schulman, C. T. (1998). Active management fund size and bond mutual fund returns. The Financial Review, 33(2), 115–125. https://doi.org/10.1111/j.1540-6288.1998.tb01372.x
Radhika, S., & Kanchana, D. P. (2017). A study on performance evaluation of mutual fund with reference to HDFC mutual fund. International Journal for Innovative Research in Multidisciplinary Field, 3(1), 45–50.
Raj, M., Verma, T., Bansal, S., & Jain, A. (2018). A comparative analysis of SBI mutual funds and HDFC mutual funds. IOSR Journal of Business and Management, 20, 36–43.
Ratner, M., & Leal, R. (2005). Sector integration and the benefits of global diversification. Multinational Finance Journal, 9, 235–267.
Rauniyar, A. (2016). Performance evaluation of Nepalese mutual funds [M Phil’s thesis]. Kathmandu University School of Management.
Rehman, A., & Baloch, Q. B. (2015). Factors affecting mutual fund performance In Pakistan: Evidence from open ended mutual funds. Abasyn Journal of social Sciences, 9(2), 211–219.
Samarbakhsh, L., & Shah, M. (2021). Fixed income mutual fund performance during and after a crisis: A Canadian case. Journal of Economics and Finance, 45, 654–676. https://doi.org/10.1007/s12197-021-09541-z
Sharpe, W. F. (1966). Mutual fund performance. Journal of Business, 39(1), 119–138.
Thapa, K., & Rana, S. B. (2011). Investment management (3rd ed.). Asmita Books Publishers & Distributors Private Ltd.
Treynor, J. L. (1965). How to rate management investment funds. Harvard Business Review, 43(1), 131–136.
Wermers, R. (2000). Mutual fund performance: An empirical decomposition into stock-picking talent, style, transaction costs, and expenses. The Journal of Finance, 55(4), 1655–1695. https://doi.org/10.1111/0022-1082.00263
Yuan, J., & Yuan, X. (2023). A comprehensive method for ranking mutual fund performance. SAGE Open, 13(2). https://doi.org/10.1177/21582440231174176
