
Journal of Development Research

 Search

Structural Equation Modelling of Behavioural Factors Influencing Intraday Trading Prospects in Nepal
Dipendra Karki1  , Niranjan Devkota2 and Rasik KC3
1Faculty of Management, Tribhuvan University, Kathmandu, Nepal
2Kathmandu Model College, Kathmandu, Nepal
3Research Management Cell, Quest International College, Pokhara University, Pokhara, Nepal

Creative Commons Non Commercial CC BY-NC: This article is distributed under the terms of the Creative Commons Attribution-NonCommercial 4.0 License (http://www.creativecommons.org/licenses/by-nc/4.0/) which permits non-Commercial use, reproduction and distribution of the work without further permission provided the original work is attributed.
Intraday trading—buying and selling the same equities within a single trading day—is still absent in Nepal. This study investigates investors’ willingness to engage in intraday trading and pinpoints the behavioural factors that shape their stock-trading decisions. Guided by behavioural finance, an exploratory design was applied. Using non-probability sampling, 226 investors in Kathmandu Valley completed structured questionnaires via KOBO Toolbox. Using SPSS–AMOS software, descriptive statistics and structural equation modeling tested the proposed relationships. Herding behaviour emerged as the dominant driver of trading decisions, amplified by information from informal channels such as social media. Traditional heuristics, prospect biases and general market conditions showed little influence on the intention to trade intraday. Regulators and market operators should prioritise trading literacy initiatives and reduce information asymmetry to foster a viable intraday market. Future studies should extend the sample beyond Kathmandu Valley to validate and refine these insights. This study sheds light on the underexplored domain of intraday trading in Nepal and offers unique insights into the behavioural aspects driving traders’ decisions, contributing to the literature on stock market dynamics in emerging economies.
Behavioural finance theory, decision-making, intraday trading, Nepal Stock Exchange, stock market
Introduction
Intraday trading is a type of economic activity in which traders purchase and sell the same stocks on the same trading day, and it is also known as a trading method for relatively short-term profit (Baralis et al., 2017; Ryu, 2012). Since 1867, when the first ticker tape was invented, stock trading has been formally started in the USA. However, there were considerable barriers to entry as it was not popular among the population. Similarly, intraday trading became famous with the introduction of electronic communications networks in 1969 (Tulchinsky, 2020). Likewise, in the late 1990s, the development of the Internet generated worldwide growth in online trading, allowing many ordinary individuals to take part in day trading methods that only professional traders had previously been available (Chung et al., 2009).
Before the Internet, there was no such thing as day trading when it came to stocks in Japan, and there were fewer traders. Since the Internet’s introduction in 1999, the number of intraday traders has risen. After the USA, the market has grown to become the second largest in the world (Fackler, 2006). Moreover, in China, there is no rule for intraday trading. The trader cannot buy and sell the stock in a day. Previously, there was a rule of day trading, but after the China Securities Regulatory Commission (CSRC) changed the rule to T + 1, which means the settlement period is trading day plus 1 day (Guo et al., 2012). Moreover, the intraday price reversal has been seen in the Taiwan stock market. There is a sharp increase in price for 15 min, and it starts to reverse for roughly 30 min. The trader highly reacted in price reversal (Chen & Liao, 2018).
The Nepal Stock Exchange (NEPSE) began operating the Nepalese stock market and legalised stock trading under the Securities Act of 2006. Intraday trading is becoming more popular among traders, and traders are flocking to the Nepalese stock market since an Internet trading system known as the trading management system (TMS) was introduced. Intraday trading is not practised, although Internet trading systems are widely used. Nevertheless, the Securities Board of Nepal (SEBON) and NEPSE have already launched research, but the results have not been drawn yet. Ryu (2012) discussed the prospect of intraday trading, where individual day traders are more likely to experience significant losses regularly and heavily. Excessive intraday trading on the stock market only benefits the market practitioners, who greatly earn from the charges of transactions to individual day traders. Moreover, governments should foresee increasing market liquidity to make it more open and lessen the information asymmetry to attract greater traders. Research may consider strategic order trading by various kinds of traders following day trading, providing a more detailed understanding of this relevant problem (Hsieh et al., 2020; Karki & Khadka, 2024). Some occurrences in one market have a greater impact on a second market than others. Focus on the fixed price determination mechanism for future research during the trading day.
Nepal is a developing country with a small economy, where the stock market is also small compared to other developing countries. Nonetheless, the stock market has had a significant long-term impact on the Nepalese economy (Karki, 2012). Recent empirical studies have emerged following the introduction of intraday trading, focusing primarily on patterns of price, volume and volatility within daily trades. As intraday trading has not been introduced in Nepal, several questions need to be addressed. They are: What are the Prospects of Intraday trading in the Nepalese equity market? What influences the trading decision in Nepalese traders? What are the challenges of the Intraday trading market in Nepal? What are the managerial solutions? This study intends to understand the prospect of intraday trading in the Nepalese stock market and whether they are willing to participate in intraday trading, addressing factors that influence their decision to choose a stock for trading, highlighting the opportunities and challenges that can be faced while trading.
The remainder of this study is organised as follows: The ‘ Literature Review’ section introduces relevant earlier theories and empirical research, providing context for the investigation, while the ‘Materials and Methods’ section explains and explaining the research methodology, including the empirical technique. The ‘Results and Analysis’ section presents the study’s findings and examines their consequences. The ‘Discussion’ section discusses these findings, and the ‘Conclusion and Recommendation’ concludes the study.
Literature Review
Intraday trading has progressed considerably worldwide due to advances in technology and changes in regulations. In the USA, although intraday trading existed informally since the invention of the ticker tape in 1867, it became widely popular only after electronic communication networks like Instinet (1969) and NASDAQ (1971) were introduced, alongside the elimination of fixed commissions in 1975 (Tulchinsky, 2020). The rise of Internet accessibility in the late 1990s further opened day trading to ordinary investors (Chung et al., 2009).
In Asia and Europe, the adoption of intraday trading varies by country. After 1999, Japan saw rapid growth in online trading and is now the second-largest financial market in the world, following the USA (Fackler, 2006). China initially allowed same-day trading (T + 0) for both A- and B-shares starting in 1990 but switched to T + 1 for A-shares in 1995 and later extended that to B-shares in 2000 (Guo et al., 2012). Taiwan’s market experienced notable intraday price reversals and overreactions shortly after market opened (Chen & Liao, 2018). Poland’s Warsaw Stock Exchange experienced a boost in algorithmic intraday trading and lower transaction costs following the launch of the Universal Trading Platform in 2013 (Miłobędzki & Nowak, 2018). In Australia, the ASX allows short selling on certain stocks with strict disclosure requirements, showing characteristic patterns in order depth across trading sessions (Helmes et al., 2012).
South Asia presents a different scenario. India’s electronic National Stock Exchange operates continuously without market makers, with low transaction costs and rolling settlements that favour intraday trading (Sampath & Gopalaswamy, 2020). Recent reforms, such as share dematerialization and improved transparency, have increased intraday trading opportunities and attracted wider participation (Pati & Rajib, 2010).
Conversely, Nepal’s stock market remains in an earlier stage of development. Established in 1993 with trading commencing in 1994 (Shrestha & Subedi, 2014), Nepal still operates with a T + 3 settlement cycle, limiting real-time trading potential. Despite the adoption of electronic systems like Central Depository System (CDS) and TMS, intraday trading is not yet allowed under current regulations (Dhakal, 2014). Though there has been significant growth in traders and improvements in information technology, the NEPSE has only recently begun to investigate the introduction of intraday trading (Chalise, 2020). Compared to its regional neighbours, Nepal lacks the necessary legal and operational framework for intraday trading, making this study important in addressing the readiness and regulatory needs of Nepal’s emerging market.
Theories on Intraday Trading
The researcher employed five theories to acquire a better knowledge of investing in stocks and to assess the trader’s decision in intraday stock trading in Nepal. They are: rational expectation theory (Sargent, 1961), greater fool theory (Bogan, 2016; Liu et al., 2017), behavioural finance theory (Hammond, 2015), efficient market hypothesis (Fama, 1970; Mathur, 2020) and modern portfolio theory (Markowitz, 1952). Rational expectation theory gives the trader useful information for purchasing and selling stocks, where the traders buy stocks with the expectation that the price will grow in the future and sell stocks with the expectation that the price will decrease in the future (Karki et al., 2024; Muth, 1961; Sargent, 1961). Likewise, the greater fool theory explains that the essence of a trader (a greater fool) is always willing to pay a higher price for an already excessively expensive asset (Roberts & Beckman, 1973). Similarly, Hammond (2015) revealed that behavioural finance theory counters the efficient market hypothesis with research based on market participants’ judgment and decision-making processes. Moreover, the theory of an efficient market hypothesis shows that the market always works efficiently and always trades at fair value, which makes it essentially impossible for the trader to buy stocks with an overvalued or an overvalued rate (Mathur, 2020). Likewise, modern portfolio theory is a risk-averse trader’s technique for constructing diversified portfolios that optimise returns while avoiding unacceptable levels of risk (Markowitz, 1952).
After reviewing the numerous theories, the behavioural finance theory appears to be the greatest fit for study as it assists with reasonable defects and provides a plethora of lucrative opportunities for knowledgeable traders who use behavioural concepts to determine which low-cost equities frequently beat the market. Atif Sattar et al. (2020) show that the key contribution of the research was to look at how behavioural factors influence trading decision-making in uncertain settings. Likewise, Cao et al. (2021) in their study try to figure out how behavioural aspects affect individual traders’ trading decisions and outcomes. Moreover, Lai’s (2019) study reveals that behavioural finance has been used extensively in the financial industry from psychological perspectives, focusing on herding and disposition effects. Likewise, the study of Asad et al. (2018) shows learning more about the psychological factors that impact individual traders’ trading decisions in a developing country. According to Kengatharan and Kengatharan (2014) in their study gives four behavioural aspects that impact individual traders’ trading decisions: herding, heuristics, prospect and market.
Figure 1. Conceptual Framework.
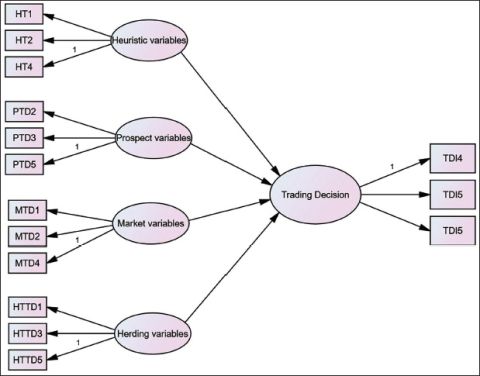
Source: Adopted and modified from Kengatharan and Kengatharan (2014).
Figure 1 illustrates the study framework opted by the authors, which was adopted and modified by Kengatharan and Kengatharan (2014). Prospects, Heuristics, Herding and Markets are the four exogenous factors listed, whereas the trading decision is the dependent variable.
Hypotheses Formulation
Heuristic Variables and Trading Decisions of Individual Traders
Heuristics, which are fundamental components of decision-making relying on norms of thumb (Cheng et al., 2016), enable humans to reach conclusions more rapidly than if they were to logically evaluate the information at hand. Furthermore, to reduce mental effort and mitigate the risk of loss in uncertain circumstances, traders utilise heuristic biases, including adjustment, overconfidence, availability and anchoring. However, this approach occasionally results in erroneous judgments, which may contribute to market inefficiency (Abarbanell & Bernard, 2015).
H1: The heuristic variable significantly influences the trading decisions of individual traders.
Prospect Variables and Trading Decisions of Individual Traders
Escalation circumstances feature some of the most critical and challenging decisions made in trading. In many circumstances, the difficulty in selecting whether or not to spend further resources on a lost strategy leads to a rising commitment process (Whyte, 1993). Prospect theory is a method of analysing unpredictable outcomes and risks that can be employed in different disciplines of economics, such as insurance, finance, the capital market and industry. Each sector has its own set of risks and adjustments. One of the key factors influencing individual decisions is prospect theory (Benartzi & Thaler, 2007). Regret aversion, loss aversion and mental accounting are the prospect variables that affect trading decisions.
H2: Prospect variable significantly impacts the trading decisions of individual traders.
Market Variables and Trading Decision of an Individual Trader
Trading behaviour is influenced by a variety of market variables, including price fluctuations, political and social news, trend forecasts, information from others, and the significance of individual equities (Waweru, 2008). Traders should pay special attention to stock information and be reminded that, to make reasonable judgments, they must examine market information (Epstein & Freedman, 1994; Ghimire & Karki, 2022). Customer preference, market information, price fluctuations, historical stock trends, underlying stock fundamentals, overreaction to price fluctuations and customer preference are all market variables that impact trading decisions (Nagy & Obenberger, 1994).
H3: Market variables significantly influence on trading decisions of individual traders.
Herding Variable and Trading Decision of Individual Traders
Herding is characterised by individuals imitating the actions of others, despite possessing private information that would indicate an alternative course of action (Banerjee, 1992). Herding is like repeating previous actions, whether sensible or illogical. The study of Fernández et al. (2011) reveals that traders rely on incorrect information because they are more likely to accept the ideas and decisions of others. When it comes to gathering information and assessing financial concerns, herding mainly impacts individual traders, and thus the herding behaviour may be based on the trading decisions of other traders. Likewise, traders’ sentiments towards different publicly traded corporations are influenced by the information available to them (Khelda, 2011; De Bondt & Thaler, 1985).
H4: Herding variable significantly influences on trading decisions of individual traders.
Trading Decision of an Individual Trader
Trading decisions are impacted by different factors like heuristics, herding, the market and prospect factors, where the individual traders evaluate the rewards of spending in the present scenario against the benefits of investing unused funds to experience faster growth in the future. If the individual decides to postpone trading, the trader will choose a portfolio that maximises long-term benefits (Lin, 2015).
Empirical Framework
Structural equation modelling (SEM) is a powerful statistical tool for predicting relationships between various types of variables, including both observed and latent constructs (Tarka, 2018). Although SEM modelling has been used extensively in multiple sectors of study, there is very little research in the scholarly literature that has been done on the prospects of intraday trading in the Nepalese stock market. Thus, this study uses SEM to try to close the gap in the literature. The conceptual framework and model specification draw on the dimensional approach and SEM (Donaldson, 1999). Generally, the measurement model discussed by Donaldson (1999) is specified as:
 (1)
(1)
The endogenous and exogenous variables’ latent constructs are linked to observable variables via measurement equations. These equations are described as below:
 (2)
(2)
 (3)
(3)
where, x = input variables; y = outcome variables; Λy = Observed outcome variables; Λx = observed input variables; η = latent endogenous variables; ξ = latent exogenous variables; δ and ε = measurement errors for x and y, respectively.
In this model, the vector y comprises the observed response variables, while x includes the observed input variables. The vectors δ and ε capture measurement errors associated with x and y. The observed variables x and y are used to compute the factor loadings (Λx and Λy) on the corresponding latent variables (ξ and η), which are unobserved constructs.
The structural model includes:
α: a vector of intercepts,
β: a matrix representing the relationships among endogenous latent variables (η), with zeros on the diagonal and a non-singular matrix (I – β),
γ: a matrix of coefficients linking exogenous latent variables (ξ) to endogenous latent variables (η),
ζ: a vector of structural disturbances or residuals.
Nevertheless, in the case where errors solely affect the y-variables, the reduced form of the structural model can be represented by Equations (1) through (3) as follows:
 (4)
(4)
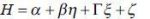
Variable and Its Definition
The key variables for this study have been carefully identified in alignment with the research objectives. While the primary variables are identified, additional variables have also been incorporated to support the study’s analytical goals. Table 1 provides a comprehensive summary of the observed factors that SEM has confirmed.
Materials and Methods
This study investigates investors’ attitudes and factors influencing their willingness to participate in intraday trading activity. An in-depth analysis of existing theories and literature has been performed to create a sound foundation for this study, which covers numerous aspects of intraday trading, investor behaviour, market dynamics and related variables.
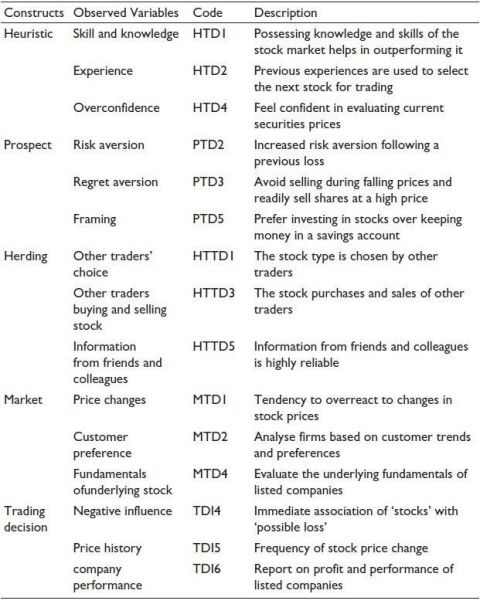
Study Area and Population
This study is conducted in the Kathmandu Valley, which comprises three districts: Kathmandu, Bhaktapur and Lalitpur, spanning a total area of approximately 570 km2 (220 miles2). Situated in Province 3 of Nepal, the valley lies between latitudes 27__degreesign32′13″–27__degreesign49′10″N and longitudes 85__degreesign11′31″–85__degreesign31′38″E. Kathmandu has a total population of 2,517,023, making it the most populous district in Nepal.
The Kathmandu Valley was selected as the research location (see Figure 2) to learn more about how stock traders participate in stock trading and their intraday trading. The presence of multiple broker offices and a significant number of knowledgeable investors makes it an ideal location for our study. According to CDS and clearing house, the total number of DEMAT accounts till December 2021 is 4,686,672 in Nepal. According to stock brokers of December 2021 total active traders and traders is 925,670 all over Nepal.
Sampling Method, Sample Size, Data Collection and Analysis
This study adopted a non-probability convenience sampling method due to the lack of a reliable and accessible database of active stock traders in the Kathmandu Valley. Without a clearly defined sampling frame, probabilistic techniques such as random sampling were not feasible. Convenience sampling allowed the researcher to target participants who were actively involved in stock trading and accessible within a limited timeframe and resource scope. The sample size for the study was (266.78 + 13.34) = 280.12 (≈280). However, due to a higher non-response rate, only 226 usable data were collected. While this method enabled practical data collection, it inherently limits the generalisability of the findings, because the sample might not accurately reflect Nepal’s broader investor population.
Table 1. Constructs and Observed Variables.
Note: HTD3, HTD5, PTD1, PTD4, HTTD2, HTTD4, MTD3, MTD5, TDI1, TDI2 and TDI3 were excluded after exploratory factor analysis (EFA) due to factor loadings below 0.5.
Data were collected using a structured questionnaire administered through the Kobo Toolbox platform. The analysis involved both descriptive and inferential approaches. Descriptive statistics were presented using tables, charts and figures, while inferential analysis was conducted through SEM to analyse relationships among latent variables. The tools employed for analysis included Microsoft Excel, Kobo Toolbox, SPSS and AMOS.
Figure 2. Study Area.
Source: GIS ArcMap 10.2.
Results and Analysis
This study analysed data collected through a structured questionnaire, capturing insights from the investors’ perspective. A wide range of analytical tools was employed to perform a thorough examination of the data. These tools comprised descriptive and inferential statistics, tabular and graphical representations, including exploratory factor analysis (EFA) and confirmatory factor analysis (CFA) conducted through SEM using SPSS–AMOS.
Descriptive Analysis
Socio-demographic Characteristics
The study reveals that the majority are male, are mostly unmarried, and have not taken any kind of training related to the stock market. The results of this research corroborate the notion that males are more inclined than females to engage in stock market trading, particularly in stock handling, which necessitates better skills, where the inexperienced and unskilled traders are trading on the NEPSE and are losing money because they have not participated in any kind of stock market training. Additionally, the findings reveal that a majority of Nepalese youth are interested in stock trading, with those with bachelor’s degrees being more active in the Nepalese stock market. Aside from stock market participation decisions, education is viewed as a crucial factor in determining risk-taking behaviour among traders. In addition, people participating in stock trading in the Kathmandu Valley are not only involved in their trade, but they are also involved in their jobs, which also indicates that the stock trading sector is fraught with risk. Lastly, this study also concludes that traders in the Kathmandu Valley utilise their savings to invest in stocks and earn between 30,000 and 50,000 and indicates that average-earning residents in the Kathmandu Valley are highly involved in the stock market (see Table 2).
Traders Profile Overview
This section explores the overall knowledge and expertise of traders through a structured questionnaire, providing insights into the current status and behaviour of participants in the stock market. The findings show that 65.62% have been trading for 2–5 years and just 0.88% have been trading for 15 years and have already traded their stock 51–100 times which covers 44.25% of traders in the Nepalese stock market whereas only 1.33% of respondents have traded more than 1,000 times in their life which demonstrates the presence fresh traders in Kathmandu’s Nepalese market. Likewise, the majority (101) of respondents have traded only 5–10 times during a year and only eight respondents traded above 100 times in the last years; and they contribute only 1–2 h per day (47.35%) to surf in stock market whereas only 7 out of 226 respondents participate full-time in the stock market, with the highest time contribution of 4 h. The Nepalese stock market is open from 11 am to 3 pm. for only 4 h. It demonstrates that traders place a lower focus on the stock market and usually trade less since they are not solely concerned with trading.
Table 2. Socio-demographic Characteristics.
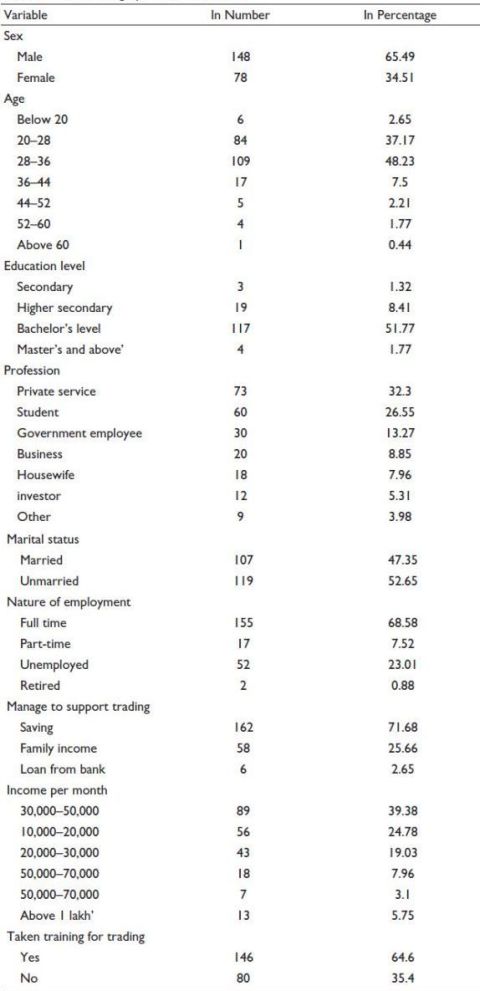
Likewise, the result also revealed that 94 of the 226 respondents use 1–5 lakhs of their money for trading, while the minimal respondents (7) use more than 10 lakhs to trade stocks. It demonstrates that the Nepalese stock market has a large number of minor players. Similarly, 92.04% of respondents want to sell when profit is high, and only 1.77% want to sell under other circumstances and agree on the fact that they buy stock when the price is falling (86.73%). This indicates the fact that people wish to sell shares based on the current scenario when the price begins to increase in the average position. Respondents were also asked whether they needed preparation before starting trading. It was revealed that 88.94% of respondents accept the lots of preparation needed before starting stock trading, and only 11.06% of respondents oppose this fact, which indicates that they are well prepared for stock trading in the context of the Nepalese stock market. Similarly, traders were asked to analyse the status of the stock market and design a strategy to cope with it through a questionnaire. The majority of 226 respondents (216) agree that studying the stock market and developing a plan to cope with it is vital.
Trading Prospect in the Stock Market
This section describes the general trading system used in intraday trading. The result indicates that 209 respondents are aware of the current trading system, 130 are aware of the share delivery date, 155 are aware of the payment date, 183 are aware of the purchase order and 166 are aware of the sale order, where the respondents are asked to choose more than one option. Thus, it shows that all respondents are aware of the current Nepalese stock trading system and understand the trading mechanism. Likewise, 100 respondents out of 226 want to retain stock for immediate sale, 68 want a short period, and 58 want to hold stock for a long period. This indicates that the majority of traders want their stock to be available for buy and sale immediately, while only a few prefer to hold for a long period. The traders who live in the Kathmandu Valley desire to do their trade as quickly as possible. Moreover, the researcher attempted to ask traders if they wish to profit from such fluctuations and the results indicated that 91.59% of respondents desire to earn a profit, while 8.41% are uninterested in making such a profit and want to trade their stock without owning the stock ownership (75.22% of respondents) preferring the immediate transactions of their stock. It shows that traders residing in Kathmandu Valley want to trade without transferring stock in the DEMAT account and want an immediate transaction system in the stock market.
Moreover, the researchers also aim to discover traders who are prepared to purchase and sell shares on the same day. The study revealed that 80.09% of respondents prefer same-day transactions, while 19.91% do not. Likewise, 75.22% of respondents want to create a second account, while the remaining 24.78% do not want to create a separate account. It concludes that traders in the Kathmandu Valley require a separate account. The researchers also attempt to assess traders’ willingness to square off and find that 58.85% of respondents want to square off the stock, and others oppose this fact. Likewise, 61.06% of respondents are willing to take broker-provided facilities, whereas 38.94% are unwilling to accept broker-provided facilities. This indicates that brokers are providing somewhat satisfactory facilities to the traders, including a margin loan facility with a variable interest rate (Bhandari et al., 2021). Leverage is effectively a loan issued by the broker to a trader, where some brokers may restrict the amount of leverage utilised by rookie traders at first (Heimer & Simsek, 2019). The result indicates that 226 respondents, 204 and 196 respondents are willing to accept the facilities of leverage and loan, respectively, provided by the broker.
Impact of Behavioural Factors on Trading Decision
The traders’ behaviour factors must be studied in this part since the research is centred on determining the aspects that influence traders’ trading decisions. Five variables assess the significant aspects of stock trading, namely Heuristic behaviour, prospect factors, herding behaviour, market factors and trading decisions. A five-point rating system is used to evaluate these factors: strongly disagree (1), disagree (2), agree (4), neutral (3) and highly agree (5).
Heuristics include explanatory variables such as skill and knowledge, experience and overconfidence. According to the results, the majority of people think that their abilities and stock market expertise will enable them to perform better in the stock market, where their previous experience helps to select the next stock, and agree on the fact that they feel overconfident in the stock price in the future. The average of the Likert Scale is above 4.01 for skill and knowledge, experience and overconfidence, which reflects that there is a response of agreement from traders regarding heuristic factors in trading decisions. A similar research conducted by Shah et al. (2018) explores the association between heuristic biases in trading decisions and perceived market efficiency and found that biases have a significantly unfavourable influence on trading choices made by individual traders actively trading on the Pakistan stock market.
Risk aversion, regret aversion and narrow framing are the explanatory variables under the construct prospect in the research on intraday trading in Nepal’s stock market. The result indicates that most people agree that after a prior loss, there is more risk in averseness, although traders analyse the connection between the stocks; thus, the majority of traders agree that they invest their money in the stock market rather than keeping it in a bank. The average of the Likert Scale is above 4.05 for risk aversion, regret aversion and framing, which reflects that there is a response of agree from traders regarding the prospect variable in trading decisions. The similar research conducted by Ding et al. (2004) shows that traders who are confident in the price change seek greater risk. When the information is from the inside of an organisation, the trader feels confident and seeks high risk.
Likewise, herding includes the explanatory variables such as other investors’ choice, other investors’ buying and selling stock, and information from friends and colleagues. According to the survey, traders concur that they choose their stocks based on what others choose, what traders often trade and that they rely on information about stocks offered by their friends and coworkers. The average of the Likert Scale is above 3.6, which reflects that there is a moderate level of response from traders regarding the Herding variable in trading decisions. As per Dutta et al. (2020), revealed that herding and panic are really the outcome of a profound guilt on the part of the trader, which causes them to panic and herd. Despite this, traders make trading choices using heuristics.
The market contains the explanatory variables such as the fundamentals of the underlying stock, price changes and customer preference (Maharjan et al., 2022). The outcome suggests that traders agree on evaluating customer preference before trading stocks and that they consider a company’s fundamentals before trading, but that they overreact when prices fluctuate. The average of the Likert Scale is above 3.6, which reflects that there is a moderate level of response from traders regarding the market variable in trading decisions. A similar study done by Kengatharan and Kengatharan (2014) reveals that the market variable shows a moderate response on individual traders' decision-making.
Similarly, trading decisions contain explanatory variables such as negative influence, price history and company performance. The study’s findings show that traders typically keep an eye on stock prices as they fluctuate frequently, evaluate the performance and profitability of listed companies, and then make trading decisions. However, they also acknowledge that poor trading decisions result in constant losses for traders in the stock market. The average of the Likert Scale is above 3.93 for negative influence, price history and company performance, which reflects that there is a moderate level of response from traders.
Challenged in Stock Trading
Respondents are asked whether the traders face challenges during stock trading. The result indicates that 76.55% face the challenge in the Nepalese stock market, whereas only 23.45% said they have not faced any difficulties during stock trading. The major challenges faced by the stock traders in the Nepalese stock market are a lack of brokers’ support (67.7%) and TMS crash during trading (61.5%). Other sub challenges are a lack of stock trading awareness (43.81%), Internet connection (43.36%), lack of a good online trading system (36.73%), and lack of financial institution (FI) support (22.57%) (see Table 3). According to the study (Karki et al., 2023; Koirala & Bajracharya, 2002), the challenges that arise in the stock market are the political-economic context, legislative provisions and the dominance of FI.
Table 3. Major Challenges Faced by Stock Traders.
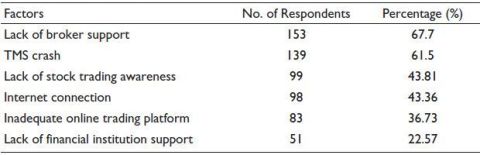
Source: Survey.
Note: TMS: Trading management system.
Moreover, respondents were asked questions such as where these challenges arise, and the result indicates that they came from technical factors (116) and political factors (131). Likewise, 103 respondents think that challenges are rising from economic factors, and 60 respondents out of 226 confirm that the challenges have arisen from social aspects. Moreover, 157 respondents chose that broker, 118 say NEPSE, 105 respondents say the trader themselves, 83 respondents agree with FIs, whereas only eight respondents say that others, like politics and the finance minister, are responsible for the cause of the problems.
Managerial Solution
This section discusses the managerial approach and input from respondents in order to solve the challenges and obstacles that stock market traders face. Respondents were asked whether managing challenges helps to run the share market smoothly. The result revealed that 164 respondents agree that the challenges and barriers of the stock market are manageable, whereas only 9 respondents do not agree with this fact. Likewise, this study also proposes how the market would work smoothly and revealed that majority (30) of respondents suggest motivating traders, growth of capital market (30), smooth operation of stock market (25), reliable and transparent system (20), efficiency in stock and predictability increase (15), attract people in stock market (15), easy trading system (15) and fair rule and regulation (14) are main aspects that need to be considered for smooth market operation in stock market.
Likewise, the finding documented that large percentage of respondents (95%) suggested to increase the speed of broker, good full support from brokers, FI and capital (50%), making good policies (40%), technology advancement (40%), introducing new trading system like intraday trading, delivery market and so on (30%), increasing the trading days and hours (20%), provide training and awareness program to new traders (15%), and need of one and simple application (50%) (see Figure 3).
Thus, NEPSE and SEBON should work together to enact strict regulations that curb market insider trading. SEBON must enhance its oversight of brokerage firms, as delays and inefficiencies in their services have become a major source of frustration for investors. Traders often face demotivation due to brokers holding shares and funds for extended periods. To address these concerns, SEBON should consider issuing brokerage licenses to qualified FIs, thereby promoting competition and improving overall service quality in the securities market. A similar study conducted by Koirala and Bajracharya (2002) found that the solution for challenges is good corporate governance, transparency and disclosure of information.
Inferential Analysis
This section encompasses various statistical techniques used to analyse the data, including descriptive statistics, EFA, CFA, path analysis, mediation analysis, estimation model and hypothesis testing.
Figure 3. Recommendation to Improve the Trading System.
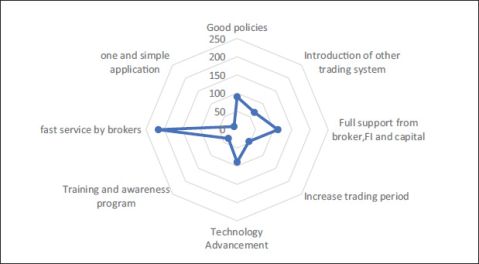
Source: Field survey.
Descriptive Summary Statistics
The study used the standard deviation, skewness, kurtosis and the mean to summarise the dataset. The mean scores of the respondents ranged from 3.57 to 4.10, with standard deviations between 0.53 and 0.87, indicating moderate variability in responses. Skewness, which reflects the asymmetry of the distribution, ranged between −1 and +1, suggesting a slight negative skew in the data. Kurtosis values fell within the range of −4 to +4, implying that the data distribution is neither excessively peaked nor overly flat, aligning with the acceptable thresholds proposed by Allua and Thompson (2009).
EFA and Common Method Bias’
Prior to conducting factor analysis, the dataset’s suitability was assessed using the Kaiser–Meyer–Olkin (KMO) measure of sampling adequacy and Bartlett’s test of sphericity. The KMO value of 0.703 satisfies the minimum threshold of 0.70, confirming adequate sampling adequacy (Iskamto et al., 2020). Furthermore, Bartlett’s test yielded a significance value of .000 (p < .05), indicating that the correlations among variables are sufficiently large for factor analysis. This indicates that there are no issues of data dependability and validity, and the data is significant for the analysis. Moreover, Harman’s single-factor test is used to determine if the study suffers from common method bias; the result indicates that 23.61%, which is less than 50% (Aguirre & Hu, 2019), indicating that the study is free of common method bias.
Measurement Model (Validity of Data) and CFA
To establish convergent validity, the data must satisfy the conditions of composite reliability (CR) greater than 0.70 and average variance extracted (AVE) greater than 0.50. For discriminant validity, the AVE for each construct should exceed the maximum shared variance (MSV), and the square root of the AVE must be greater than the corresponding inter-construct correlations (see Table 4 and Table 5). Thus, the result indicates that both convergence and discriminant validity are validated and thus taken data set is reliable.
CFA examines whether a collection of components influences answers in the expected way. The fitness indices CMIN/DF, RMR, RMSEA, IFT, GFI, CFI and TLI were applied to determine whether the model fits the data well. From the study CMIN/DF (2.257 < 5), RMSEA (0.075 < 0.08), RMR (0.023 < 0.08), GFI (0.908 > 0.80), TLI (0.961 > 0.90) and CFI (0.970 > 0.90) respectively, which shows that the study has excellent model fit. Figure 4 presents the structural estimation model.
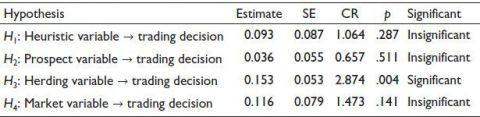
Hypothesis Testing
As summarised in Table 6, hypotheses H1, H2 and H4 were rejected, demonstrating no statistically significant relationships between the respective variables. In contrast, H3 was supported, suggesting a meaningful relationship between the constructs involved.
Table 4. Reliability and Validity.
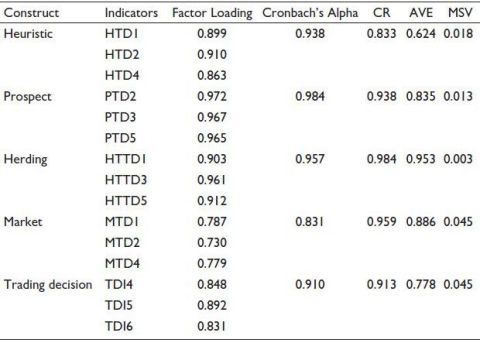
Note: AVE: Average variance extracted; CR: Composite reliability; MSV: Maximum shared variance.
Table 5. Correlation of Latent Variable.
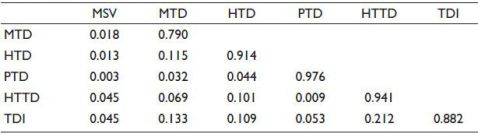
Source: Field survey.
Note: HTD: Heuristic variable; HTTD: Herding variable; MSV: Maximum shared variance; MTD: Market variable; PTD: Prospect variable; TDI: Trading decision.
Figure 4. Structural Estimation Model.
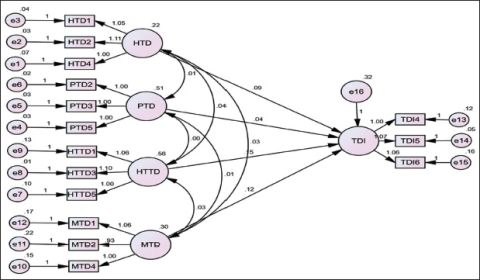
Source: SPSS–AMOS.
Note: HTD: Heuristic variable; PTD: Prospect variable; HTTD: Herding variable; MTD: Market variable; TDI: Trading decision.
SEM was employed during the inferential phase to conduct regression analysis, evaluate variable relationships and assess data normality. Five latent constructs were analysed in relation to their observed variables. The model demonstrated a good overall fit, with a chi-square to degrees of freedom ratio (CMIN/DF) of 2.257, which is well below the acceptable threshold of 5. Additionally, the p values associated with the relationships between latent and observed variables were found to be below .10, indicating statistical significance. Therefore, the study concludes that the herding variable has a significant influence on trading behaviour, while other proposed relationships lack sufficient empirical support.
Table 6. Path Estimates for Structural Model.
Discussion
To explore the relationship between behavioural factors and trading decisions, this study employed reliability tests, multiple linear correlation analysis and SEM. The key constructs examined included heuristics, prospect theory, herding behaviour and market factors. Among the proposed hypotheses, only H3 is significant, whereas H1, H2 and H4 are insignificant in this study.
The hypothesis (H3) is accepted as the herding variable affects the trading decision. The stock was chosen by Nepalese traders as a result of other traders’ buying and selling choices. Investors choose to trade a stock based on the recommendations of other traders who largely rely on the information from friends, family and colleagues. When traders make judgments based on inaccurate information, they are more inclined to accept other people’s opinions and decisions. Herding has the most influence on individual Trading decisions when it comes to acquiring information and analysing financial problems (Hilton, 2001).
While the study provides valuable insights, several limitations must be acknowledged. First, the relatively small sample size limits the generalisability of the findings. Second, the study relied exclusively on a structured questionnaire; incorporating qualitative methods, such as in-depth interviews or focus group discussions, could have enriched the understanding of the psychological and contextual factors behind trading decisions. Third, although COVID-19 severely impacted various sectors, Nepal’s stock market experienced an unusual surge during this period, reaching record highs. Pandemic-related constraints limited the ability to collect a larger sample, highlighting the need for future studies with broader data coverage.
Conclusion and Recommendation
This study examined the willingness of investors in the Kathmandu Valley to engage in intraday trading and identified key behavioural factors that influence stock trading decisions. Findings reveal a strong interest among Nepalese investors in intraday trading, despite its absence in the current stock market structure. However, this interest is significantly shaped by behavioural influences, particularly herding behaviour, where traders rely heavily on information from informal and often unreliable sources like social media, friends and family. Other psychological factors, such as heuristics, prospect biases and general market perceptions, showed minimal influence on trading decisions in this context.
In addition to behavioural aspects, structural challenges also emerged as critical barriers to effective trading. These include recurring issues with the TMS, limited broker support, weak technological infrastructure, low awareness of trading mechanisms, and insufficient institutional assistance. To address these obstacles, the study recommends implementing strong regulatory guidelines for intraday trading, enhancing the reliability of trading platforms, providing continuous support and education through brokers and FI, and launching targeted trading literacy programs. These measures are essential not only to support the introduction of intraday trading in Nepal but also to improve overall investor confidence and market efficiency.
This research makes significant theoretical and practical contributions. Theoretically, it extends the relevance of behavioural finance to emerging and frontier markets by demonstrating how social and psychological factors, particularly herding behaviour, dominate investor decision-making in the absence of mature regulatory and informational infrastructures. It challenges the assumption that individual rationality guides investment choices, especially in contexts where financial literacy and reliable data access are limited. Practically, the study offers valuable policy insights for capital market regulators, brokers and FI in Nepal. By identifying both behavioural drivers and systemic barriers to intraday trading, it provides a foundation for designing investor-centred strategies, educational interventions and technological upgrades. Moreover, it opens new avenues for future research to explore investor behaviour in similar developing market settings.
Declaration of Conflicting Interests
The authors declared no potential conflicts of interest with respect to the research, authorship and/or publication of this article.
Funding
The authors received no financial support for the research, authorship and/or publication of this article.
ORCID iDs
Dipendra Karki https://orcid.org/0000-0001-9045-7423
Niranjan Devkota https://orcid.org/0000-0001-9989-0397
Abarbanell, J. S., & Bernard, V. L. (2015). Tests of analysts’ overreaction/underreaction to earnings information as an explanation for anomalous stock price behavior. The Journal of Finance, 47(3), 1–10.
Aguirre-Urreta, M. I., & Hu, J. (2019). Detecting common method bias: Performance of the Harman’s single-factor test. Data Base for Advances in Information Systems, 50(2), 45–70. https://doi.org/10.1145/3330472.3330477
Allua, S., & Thompson, C. B. (2009). Inferential statistics. Air Medical Journal, 28(4), 168–171. https://doi.org/10.1016/j.amj.2009.04.013
Asad, H., Khan And, A., & Faiz, R. (2018). Behavioral biases across the stock market investors. Pakistan Economic and Social Review, 56(1), 185–209.
Atif Sattar, M., Toseef, M., & Fahad Sattar, M. (2020). Behavioral finance biases in investment decision making. International Journal of Accounting, Finance and Risk Management, 5(2), 1–69. https://doi.org/10.11648/j.ijafrm.20200502.11
Banerjee, A. V. (1992). A simple model of herd behavior. JSTOR: The Quarterly Journal of Economics, 107(3), 797–817.
Baralis, E., Cagliero, L., Cerquitelli, T., Garza, P., & Pulvirenti, F. (2017). Discovering profitable stocks for intraday trading. Information Sciences, 405(1), 91–106. https://doi.org/10.1016/j.ins.2017.04.013
Benartzi, S., & Thaler, R. H. (2007). Heuristics and biases in retirement savings behavior. Journal of Economic Perspectives, 21(3), 81–104. https://doi.org/10.1257/jep.21.3.81
Bhandari, U., Jaisi, T., Devkota, N., Karki, D., Adhikari, D. B., Paudel, U. R., & Parajuli, S. (2021). Retail loan under interest rate fluctuation in Nepal: Costumers interest, challenges, and managerial solutions. Journal of Asian Business Strategy, 11(1), 46–54. https://doi.org/10.18488/journal.1006.2021.111.46.54
Bogan, V. (2016). The greater fool theory: What is it? Hartfordfunds, 1(1), 1–10.
Cao, M. M., Nguyen, N. T., & Tran, T. T. (2021). Behavioral factors on individual investors’ decision making and investment performance: A survey from the Vietnam stock market. Journal of Asian Finance, Economics and Business, 8(3), 845–853. https://doi.org/10.13106/jafeb.2021.vol8.no3.0845
Chalise, D. R. (2020). Secondary capital market of Nepal: Assessing the relationship between share transaction and NEPSE index. Management Dynamics, 23(2), 53–62. https://doi.org/10.3126/md.v23i2.35807
Chen, C. C., & Liao, C. C. (2018). Short term intraday trading of futures market analysis. Youth Academic Annual Conference of Chinese Association of Automation, 8(1), 549–554. https://doi.org/10.1109/YAC.2018.8406435
Cheng, L., Hu, W., Jia, X., & Runco, M. A. (2016). The different role of cognitive inhibition in early versus late creative problem finding. Psychology of Aesthetics, Creativity, and the Arts, 10(1), 32–41. https://doi.org/10.1037/aca0000036
Chung, J. M., Choe, H., & Kho, B. C. (2009). The impact of day-trading on volatility and liquidity. Asia-Pacific Journal of Financial Studies, 38(2), 237–275. https://doi.org/10.1111/j.2041-6156.2009.tb00014.x
De Bondt, W. F. M., & Thaler, R. (1985). Does the stock market overreact? The Journal of Finance, 40(3), 793–805. https://doi.org/10.1111/j.1540-6261.1985.tb05004.x
Dhakal, B. (2014). Stock exchange. Department of Computer Science and Engineering, 1(1), 367–372. https://doi.org/10.4135/879879797
Ding, D. K., Charoenwong, C., & Seetoh, R. (2004). Prospect theory, analyst forecasts, and stock returns. Journal of Multinational Financial Management, 14(4–5), 425–442.
Donaldson, L. (1999). Performance-driven organizational change: The organizational portfolio. The contingency theory of organizations. Organizational Behaiour, 7, 333–365.
Dutta, A., Sinha, M., & Gahan, P. (2020). Perspective of the behaviour of retail investors: An analysis with Indian stock market data. Advances in Intelligent Systems and Computing, 990(1), 605–616. https://doi.org/10.1007/978-981-13-8676-3_51
Epstein, J. M., & Freedman, M. (1994). Social disclosure and the individual investor. Accounting, Auditing & Accountability Journal, 7(1990), 38–59.
Fackler, M. (2006). In Japan, day-trading like it’s 1999. The New York Times.
Fama, E. F. (1970). Efficient capital market, a review of theory and empirical work. Journal of Finance, 25, 383–417.
Fernández, B., Garcia-Merino, T., Mayoral, R., Santos, V., & Vallelado, E. (2011). Herding, information uncertainty and investors’ cognitive profile. Qualitative Research in Financial Markets, 3(1), 7–33. https://doi.org/10.1108/17554171111124595
Ghimire, M., & Karki, D. (2022). Brand loyalty among mobile users. NCC Journal, 7(1), 1–14. https://doi.org/10.3126/nccj.v7i1.58612
Guo, M., Li, Z., & Tu, Z. (2012). A unique “T+1 trading rule” in China: Theory and evidence. Journal of Banking and Finance, 36(2), 575–583. https://doi.org/10.1016/j.jbankfin.2011.09.002
Hammond, R. C. (2015). Behavioral finance: It’s history and its future. Selected Honors Theses, 1(1), 44.
Heimer, R., & Simsek, A. (2019). Should retail investors’ leverage be limited? Journal of Financial Economics, 132(3), 1–21. https://doi.org/10.1016/j.jfineco.2018.10.017
Helmes, U., Henker, J., & Henker, T. (2012). The effect of the ban on short selling on market efficiency and volatility. SSRN Electronic Journal, 9(13), 1–55. https://doi.org/10.2139/ssrn.1688135
Hilton, D. J. (2001). The psychology of financial decision-making: Applications to trading, dealing, and investment analysis. Journal of Psychology and Financial Markets, 2(1), 37–53. https://doi.org/10.1207/s15327760jpfm0201_4
Hsieh, T. Y., Fu, Y. F., & Ma, S. Y. (2020). Impacts of day trading on the intraday pattern of market quality. International Journal of Services, Technology and Management, 26(1), 20–37. https://doi.org/10.1504/IJSTM.2020.105396
Iskamto, D., Ghazali, P. L., Aftanorhan, A., Jenita, Sukono, & Bon, A. T. (2020). Exploratory factor analysis (EFA) to measure entrepreneur satisfaction. Proceedings of the International Conference on Industrial Engineering and Operations Management, 1(1), 2585–2593.
Karki, D. (2012). Economic impact of tourism in Nepal’s economy using cointegration and error correction model. ResearchGate, 1–12. http://dx.doi.org/10.13140/RG.2.1.4839.5684
Karki, D., & Khadka, P. B. (2024). Momentum investment strategies across time and trends: A review and preview. Nepal Journal of Multidisciplinary Research, 7(1), 62–83. https://doi.org/10.3126/njmr.v7i1.65249
Karki, D., Bhattarai, G., & Khadka, P. B. (2023). Nature and dynamics of stock market: A bibliometric analysis of its development and operations as an economic agency. NCC Journal, 8(1), 74–98. https://doi.org/10.3126/nccj.v8i1.63672
Karki, D., Dahal, R. K., & Bhattarai, G. (2024). Rational and irrational influences on investing decisions. Corporate & Business Strategy Review, 5(2), 92–101. https://doi.org/10.22495/cbsrv5i2art8
Kengatharan, L., & Kengatharan, N. (2014). The influence of behavioral factors in making investment decisions and performance: Study on investors of Colombo Stock Exchange, Sri Lanka. Asian Journal of Finance & Accounting, 6(1), 1. https://doi.org/10.5296/ajfa.v6i1.4893
Khelda, K. M. A. (2011). Factors affect the investment decision in exchange markets in developing countries. Corporate Ownership and Control, 9(1), 319–324.
Koirala, P., & Bajracharya, P. (2002). Nepalese capital market: Issues and challenges. Economic Review, 4–19.
Lai, C. P. (2019). Personality traits and stock investment of individuals. Sustainability (Switzerland), 11(19), 1–10. https://doi.org/10.3390/su11195474
Lin, T. C. W. (2015). Reasonable investor. Boston University Law Review, 1(1), 461–518.
Liu, Y., Wang, Q., Lee, B., & Groves, D. (2017). Greater fool theory: Potential application to tourism. International Journal of Business and Commerce, 6(03), 7–17.
Maharjan, R., Devkota, N., Mahapatra, S. K., Paudel, U. R., Parajuli, S., Bhandari, U., & Karki, D. (2022). Consumers’ preference on consumption of brandy among other alcoholic beverages in Kathmandu Valley, Nepal. Quest Journal of Management and Social Sciences, 4(1), 42–57. https://doi.org/10.3126/qjmss.v4i1.45866
Markowitz, H. (1952). Portfolio selection. Journal of Finance, 7(1), 77–91.
Mathur, T. (2020). The theory behind a bubble burst. SSRN Electronic Journal, 1(1), 1–6. https://doi.org/10.2139/ssrn.3629319
Miłobędzki, P., & Nowak, S. (2018). Intraday trading patterns on the Warsaw Stock Exchange. Contemporary Trends and Challenges in Finance, 12(1), 55–66. https://doi.org/10.1007/978-3-319-76228-9_6
Muth, J. F. (1961). Rational expectations and the theory of price movements. Econometrica, 29(3), 315. https://doi.org/10.2307/1909635
Nagy, A., & Obenberger, W. (1994). Influencing individual behavior investor. Financial Analysts Journal, 50(4), 63–68 https://www.jstor.org/stable/4479763.
Pati, P. C., & Rajib, P. (2010). Intraday return dynamics and volatility spillovers between NSE S&P CNX Nifty stock index and stock index futures. Applied Economics Letters, 18(6), 567–574. https://doi.org/10.1080/13504851003742442
Roberts, C., & Beckman, B. (1973). The greater fool theory of investment. Accountancy, 83(957).
Ryu, D. (2012). The profitability of day trading: An empirical study using high-quality data. Investment Analysts Journal, 75(1), 43–54. https://doi.org/10.1080/10293523.2012.11082543
Sampath, A., & Gopalaswamy, A. K. (2020). Intraday variability and trading volume: Evidence from National Stock Exchange. Journal of Emerging Market Finance, 19(3), 271–295. https://doi.org/10.1177/0972652720930586
Sargent, T. (1961). CC-8: Macro economic analysis-II. New Classical Macroeconomics, 1(1), 1–7.
Shah, S. Z. A., Ahmad, M., & Mahmood, F. (2018). Heuristic biases in investment decision-making and perceived market efficiency: A survey at the Pakistan Stock Exchange. Qualitative Research in Financial Markets, 10(1), 85–110. https://doi.org/10.1108/QRFM-04-2017-0033
Shrestha, P., & Subedi, R. (2014). Determinants of stock market performance in Nepal. NRB Economic Review, 26(2), 25–40. https://ideas.repec.org/a/nrb/journl/v26y2014i2p25-40.html
Tarka, P. (2018). An overview of structural equation modeling: Its beginnings, historical development, usefulness and controversies in the social sciences. Quality and Quantity, 52(1), 313–354. https://doi.org/10.1007/s11135-017-0469-8
Tulchinsky, I. (2020). Intraday trading. A Quantitative Approach to Building Trading Strategies, 2(2), 217–222.
Waweru, N. M. (2008). The effects of behavioural factors in investment decision-making: A survey of institutional investors operating at the Nairobi Stock Exchange. Proceedings of the 8th International In Situ and On-Site Bioremediation Symposium, 3(1), 1399.
Whyte, G. (1993). Escalating commitment in individual and group decision making: A prospect theory approach. Organizational Behavior and Human Decision Processes, 54(3), 430–455. https://doi.org/10.1006/obhd.1993.1018
