
Journal of Development Research

 Search
Sanghita Ghosh1 and Amit Kundu2
1Department of Economics, Adamas University, Kolkata, West Bengal, India
2Department of Economics, Jadavpur University, Kolkata, West Bengal, India

Creative Commons Non Commercial CC BY-NC: This article is distributed under the terms of the Creative Commons Attribution-NonCommercial 4.0 License (http://www.creativecommons.org/licenses/by-nc/4.0/) which permits non-Commercial use, reproduction and distribution of the work without further permission provided the original work is attributed.
The effect of the affirmative action policy on higher educational enrolment in India is addressed here. This article tries to identify the factors that play important roles in enhancing the enrolment of young people from ethnically disadvantaged groups, specifically Scheduled Castes (SC), Scheduled Tribes (ST) and Other Backward Classes (OBC) in higher education. Using the probit regression technique, it finds that females from ST communities have a lower chance of enrolling in higher education. Conversely, the probability of young females participating in higher education is higher in the OBC community. At the household level, household income, smaller family size and household location increase the probability of enrolment in higher education among young individuals from the three castes considered. Furthermore, a larger number of higher educational institutions and increased government spending on higher education also contribute to higher enrolment rates for young individuals from these socioeconomically disadvantaged households.
Higher education, SC, ST, OBC, NSSO, probit model
Introduction
Reservation is a system of affirmative action in India. It was created to provide representation in education among historically disadvantaged groups and create an opportunity to be employed as skilled workers in the labour market. In India, public-funded higher education institutions must abide by the reservation policy, which is not obligatory for private unaided institutions. According to the 2011 Census, out of the total Indian population, 18% Scheduled Caste (SC), 8% Scheduled Tribes (ST) and 43% Other Backward Classes (OBC) population were observed. Due to the reservation policy, the representation of students from disadvantaged communities in higher education has improved in India. According to the All-India Survey of Higher Education (2020–2021), the Gross Enrolment Ratio of the students belonging to the SC and ST communities has increased by 28% and 47%, respectively compared to 2014–2015. The overall increase in OBC enrolment is 31.67%. Among the females from SC, ST and OBC categories, 23.9%, 19.1% and 28.6% were enrolled in higher education, respectively.
This article will try to investigate the major beneficiaries of the reservation during their enrolment in higher education in India, that is, whether gender discrimination belonging to economically backward class households is observed in enrolment in higher education or whether students belonging to the creamy layers of SCs, STs and OBC communities are more likely to enrol in higher education or not.
Survey of Literature
The marginalisation of SC and ST communities has led to prolonged deprivation of social, economic and educational opportunities. Reservation policy is an important mechanism for promoting equal opportunities and reducing socioeconomic disparities (Mohanty, 2006). Beyond direct beneficiaries, these policies also positively influence other members of the caste groups through peer effects, role models and increased aspirations (Beaman et al., 2012). Several recent studies have examined the impact of reservation policies on education and employment (Basant & Sen, 2020; Bhattacharjee, 2018; Deshpande & Ramachandran, 2020; Khanna, 2020; Lee, 2018). Bhoi and Lakra (2022) highlight that the aspiration to pursue higher education is a key driver of empowerment among marginalised communities. Weisskopf (2004) argues that reservations in higher education improve SC and ST students’ university rankings and encourage enrolment among those who might otherwise forego higher education. Although reservations often benefit a ‘creamy layer’ of SC and ST students, this does not imply that they fail to meet their intended goals. Bagde et al. (2016) similarly conclude that affirmative action policies effectively increase enrolment among the socially most disadvantaged students. However, using data from the 61st round of the National Family Health Survey (NFHS), Basant and Sen (2010) have found that higher education participation rates among marginalised groups remain lower than the national average. A study by Basant and Sen (2019) focussing on OBC students identified no significant expansion in enrolment in Southern and North-Central states where quotas already existed, while growth was observed in Eastern states. On the other hand, Bhattacharjee (2018) reports that reservations have increased OBC participation in higher education. Chatterjee and Ranganathan (2021) provide evidence that reservations have a positive impact on securing government and private-sector employment. Notably, reservations have facilitated entry into high-status jobs, suggesting that higher education quotas positively influence employment outcomes. Similarly, Ranahasan and Mehta (2006) found that SCs, STs, OBCs and Muslims are significantly underrepresented in Indian colleges relative to their population share. This underrepresentation is primarily attributed to low higher secondary school completion rates and economic constraints, as reflected in mean per capita consumption expenditure (MPCE). Sundaram (2006), analysing the 55th round NFHS data, found that after completing higher secondary education, economic conditions no longer significantly impact marginalised students’ decisions to pursue higher education. Similarly, a study by Ghosh and Kundu (2025) using the 75th-round National Sample Survey Organization (NSSO) data reports that young students from SC, ST and OBC communities have a lower probability of joining higher education compared to the three castes ST communities have less chance to join in higher education than the other two considered communities. Also, Bagde et al. (2016) report that disparities in pre-college preparation, college enrolment and academic performance persist between disadvantaged castes and their more privileged counterparts, with participation gaps being particularly pronounced among women. Swain (2022) reports that NSS 61st round data indicate women from SC, ST and OBC backgrounds have the least access to higher education. Similarly, Ghosh and Kundu (2025) state that young women from the SC, ST and OBC communities have a lower chance of joining higher education.
Despite these findings, limited research has examined whether an enrolment gap exists between male and female students from reserved categories in higher education. Besides that, no study has yet identified which specific household segments within marginalised groups can enhance the possibility of enrolment in higher education.
Research Questions
In modern society, knowledge serves as a powerful tool for empowerment and enabling individuals to achieve greater influence and autonomy. Knowledge also acts as an important instrument to upgrade the social status of minority communities. A robust higher education system with strong minor communities plays a crucial role in enhancing a nation’s economic strength. India exemplifies this potential, being recognised for supplying a highly skilled workforce to the global market. In light of these considerations, this study aims to achieve the following objectives:
Sources of Data and Methodology
The main data source for this unit-level study is the NSSO 75th round Household Social Consumption on Education dataset.1 As this study is a combination of household and state-specific factors; hence, the state-specific data are collected from various sources such as the NFHS-4, the Ministry of Education’s Analysis of Budgeted Expenditure on Education (2016–2017 to 2018–2019), the All India Survey on Higher Education Report (2017–2018), state-wise loan disbursement data from State Bank of India (SBI) for degree and diploma courses domestically and abroad, the Periodic Labour Force Survey (PLFS) Annual Report 2017–2018 and police density data from the Bureau of Police Research and Development, Government of India.
Initially, the sample households are categorised based on 28 states, excluding Manipur, Meghalaya and Union Territories. Due to potential variations in state policies, state-specific variables are kept consistent for all sample households within a particular state. The NSSO 75th Round unit-level dataset includes 14,285 first stage units (FSUs) (8,097 villages in rural areas and 6,188 Urban Frame Survey Blocks in urban areas), encompassing 1,19,110 households (64,519 rural and 49,238 urban) and enumerating 5,13,366 individuals (3,05,904 rural and 2,07,462 urban). The survey data includes 2,67,887 males (1,59,411 rural and 1,08,476 urban) and 2,45,479 females (1,46,493 rural and 98,986 urban).
The study focuses on young individuals aged between 18 and 28 years. So, after the dataset is arranged according to 28 states, it is considered the young age group is between 18 and 28 years old. Then again, these sample households are categorised into two groups: those currently attending higher education and those who are not. The extracted sample consists of 1,08,260 young individuals. Finally, to observe the caste-wise scenario, the data is segregated between the three castes: SC, ST and OBC. Hence, the three caste-wise segregated data consist of 19,415 no. of observation for the SC, 10,091 no. of observation for the ST and 44,678 no. of observation for the OBC.
The initial objective of this article is to identify potential factors which can influence a parent’s decision for their young children at the time of enrolment in higher education institutions. To do that probit regression technique will be applied here where the outcome variable is binary. It takes the value ‘1’ if the young individuals are enrolled in a higher education level (post 10+2), and ‘0’ if they are not enrolled in a higher education level.
The probable influencing factors are outlined below, focusing on household-related variables derived from the NSSO 75th round datasets. These variables include gender, residential status, household size, consumption expenditure, computer ownership and institutional distance.
Some state-specific factors can impact the household’s decision to enrol a young individual in higher education. These are used as a proxy to investigate the influence of the neighbourhood effect, which can influence the time of making any household-related decision. Besides that, as each state adheres to distinct policies, the influence on household-level decisions may vary across states. Hence, the following state-specific policy variables are here considered and elaborated below.
The probit regression technique is here considered to address our research questions. The dependent variable in this study is ‘Enrol_HE’, a binary variable that takes the value ‘1’ if the individual is currently enrolled in higher education and ‘0’ otherwise. Given the binary nature of the dependent variable, it is not suitable to use the ordinary least squares (OLS) regression technique. When OLS regression is applied to a binary response variable, the resulting model is referred to as a linear probability model (LPM), which serves as a method for estimating conditional probabilities. However, the LPM inherently violates key OLS assumptions, such as homoskedasticity and normality of residuals, leading to biased standard errors and invalid hypothesis tests.
In contrast, logistic regression models, commonly known as logit models, provide a more appropriate framework for modelling binary outcomes. Logit models estimate the probability of an event occurring by modelling the log odds of success as a function of independent variables. This approach ensures that predicted probabilities remain within the [0,1] range and addresses the limitations of the LPM.
Mathematically, it can be written as below:
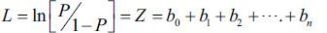 (1)
(1)
Where,
L is the log of the odds ratio,
P is the probability of an event occurring,
Z is the linear combination of independent variables with coefficients.
From this, we can also derive the probability of occurrence of the events.
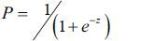 (2)
(2)
Equation (2) is also known as the logistic distribution function. As Z → − ∞, the value of approaches 0, while, as the value of Z → + ∞, the value of P approaches 1.
Although similar to logit models, probit models rely on the probit function rather than the logistic function. The probit model estimates the probability that an observation with specific characteristics falls into a particular category, making it a useful tool for modelling categorical outcomes.
The probit model can be represented using the following formula:
 (3)
(3)
Where,
Y is the dependent variable and represents the probability that the event will occur (hence, Y = 1) given the variable X.
Φ is the cumulative standard normal distribution function.
Z is the linear combination of independent variables (X) with coefficients (b0, b1, b2…bn).
In the logit model, the logistic function is used in place of Φ, the cumulative standard normal distribution function. The logit model estimates the odds of success for a given event as a function of independent variables, whereas the probit model determines the probability that observation with specific characteristics falls into a particular category. By estimating these probabilities, the probit model is particularly useful for modelling categorical outcomes across a range of classifications. Therefore, in this study, it is best to use the probit regression technique.
In this study, the objective is to observe the caste-wise enrolment scenario in higher education in India. Therefore, three models are considered separately to capture the SC, ST and OBC enrolment scenarios in India. The probit regression technique is the most suitable method for identifying the factors influencing a household’s decision to enrol their young children in higher education.
Model 1
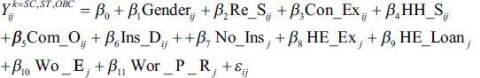 (4)
(4)
Here .png) = 1 if the young from the ith SC household of the jth state is enrolled in a higher education institute (between the age group 18–28)
= 1 if the young from the ith SC household of the jth state is enrolled in a higher education institute (between the age group 18–28)
= 0 if the ith SC household of the jth state is not enrolled in a higher education institute in that reference age group.
The values of each of the state-specific variables are the same for the sample households for the jth state.
Similarly, .png) = 1 if the young from the ith ST household of the jth state is enrolled in a higher education institute (between the age group 18–28)
= 1 if the young from the ith ST household of the jth state is enrolled in a higher education institute (between the age group 18–28)
= 0 if the ith ST household of the jth state is not enrolled in a higher education institute in that reference age group.
And .png) = 1 if the young from the ith OBC household of the jth state is enrolled in a higher education institute (between the age group 18–28)
= 1 if the young from the ith OBC household of the jth state is enrolled in a higher education institute (between the age group 18–28)
= 0 if the ith OBC household of the jth state is not enrolled in a higher education institute in that reference age group.
In all the above three situations, the explanatory variables are the same.
Results and Discussions
The regression analysis as shown in Table 1, reveals a noticeable gender disparity in higher education enrolment among ST communities in India. Despite the implementation of reservation policies intended to improve access, women from these communities remain less inclined to pursue higher education. Conversely, there is a growing trend of women from OBC enrolling in higher education institutions. The study highlights that various household characteristics significantly influence the probability of young students from SC, ST and OBC pursuing higher education. Residential status, whether the household is located in an urban area or rural area, is an important determinant here. Notably, households located in urban areas tend to have a higher propensity to send their youth to higher education institutions. This is likely due to better access to educational facilities and resources in urban settings. Additionally, the economic status of a household plays a crucial role; families with higher income levels are more likely to afford the costs associated with higher education, thereby increasing the probability of their children enrolling in such programmes. Household size emerges as a significant determinant of higher education enrolment, with larger households exhibiting a lower chance of their youth pursuing higher education. This trend may be attributed to the increased financial burden and resource constraints faced by larger families, which can limit educational opportunities for young members. Furthermore, regression analysis indicates that the presence of a computer in reserved category households significantly enhances the probability of youth enrolment in higher education. In the digital era, computers and Internet access serve as essential tools for skill development, enabling students to engage in self-paced learning from home through computer-based educational resources. Conversely, the distance between a household and higher education institutions poses a substantial barrier to enrolment among students from reserved categories. Greater distances are associated with higher commuting and accommodation costs, exacerbating the financial burden on economically disadvantaged households and further limiting access to higher education.
Table 1. Factors Affecting Higher Educational Enrolment of Different Disadvantaged Minorities.
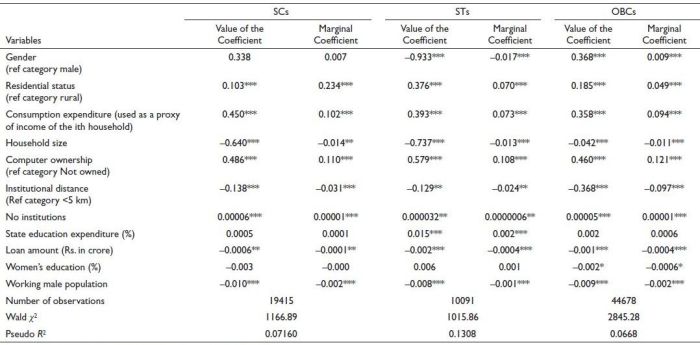
Note: ***, ** and * indicates level of significance at 1%, 5% and 10%.
At the state level, the availability of higher education institutions positively correlates with enrolment rates among SC, ST and OBC communities. States with a greater number of educational institutions tend to have higher enrolment rates, suggesting that increased accessibility and options for higher education can encourage participation from these communities. The study also points out a counterintuitive finding regarding educational loans: higher loan amounts are associated with a decreased probability of young individuals from these communities participating in higher education. This could be due to the fear of accumulating debt or the perceived financial burden of repaying loans, which may deter students and their families from pursuing higher education, despite the availability of financial assistance. While state education expenditure has a small positive effect on STs, it does not appear to significantly impact SCs or OBCs. A higher working male population negatively impacts educational outcomes, suggesting a possible trade-off between labour participation and education. As a whole, the research underscores the complex interplay of social, economic and institutional factors that influence higher education enrolment among India’s socially backward communities, highlighting the need for targeted policies that address these multifaceted challenges.
Conclusion
This study underscores the critical role of affirmative action policies, such as the reservation policy of the Government of India, in enhancing access to higher education for socially disadvantaged groups. An analysis of the NSSO 75th round data reveals significant gender disparities in higher education enrolment. Previous studies already show that SC, ST and OBC students are underrepresented in the higher education sector, but considering the gender-wise scenario this study reflects that among the STs females are less likely to join in higher education, whereas among the OBCs females are more likely to join in the same. Considering the various household-related factors, it is found that household income and urban residency notably increase the likelihood of enrolment for youth from backward castes, whereas the distance from educational institutions poses a significant barrier. It is also proved that among the economically affluent households belonging to SC, ST and OBC communities, the possibility of taking the benefit of affirmative action is much higher. State interventions, including expanding the number of higher education institutions and increasing expenditure on higher education, are shown to enhance enrolment opportunities.
Policy Prescription
Therefore, while affirmative action remains vital, it is equally important for government policies to prioritise the development of educational infrastructure and allocate greater resources to higher education. These measures will further improve enrolment rates among youth from reserved categories, fostering greater educational equity.
Declaration of Conflicting Interests
The authors declared no potential conflicts of interest with respect to the research, authorship and/or publication of this article.
Funding
The authors received no financial support for the research, authorship and/or publication of this article.
Note
ORCID iD
Amit Kundu https://orcid.org/0000-0001-7879-5243
Agarwal, P. (2009). Indian Higher Education: Envisioning the Future. Sage Publications.
All India Survey on Higher Education. (2017–2018). Ministry of Human Resource Development; Department of Higher Education, New Delhi.
All India Survey on Higher Education. (2019–2020). Ministry of Human Resource Development; Department of Higher Education, New Delhi.
Bagde, S., Epple, D., & Taylor, L. (2016). Does affirmative action work? Caste, gender, college quality, and academic success in India. The American Economic Review, 106(6), 1495–1521.
Basant, R., & Sen, G. (2010). Who participates in higher education in India? Rethinking the role of affirmative action. Economic & Political Weekly, 45(39), 62–70.
Basant, R., & Sen, G. (2019). Quota-based affirmative action in higher education: Impact on other backward classes in India. The Journal of Development Studies, 56(2), 336–360.
Basant, R., & Sen, G. (2020). Quota-based affirmative action in higher education: Impact on other backward classes in India. The Journal of Development Studies, 56(2), 336–360.
Bhattacharjee, A. (2019). Spillovers in affirmative action: Evidence from OBC quotas in India [Leeds University Business School Working Paper No. 19-03]. Leeds University Business School.
Bhoi, D., & Lakra, N. R. (2022). Marginality, educational opportunity and access to higher education: Experiences of scheduled caste and tribe students in India. Contemporary Voice of Dalit.
Deshpande, A., & Ramachandran, R. (2020). Traditional hierarchies and affirmative action in a globalizing economy: Evidence from India. World Development, 118, 63–78.
Fairlie, R. W. (2012). The effects of home access to technology on computer skills: Evidence from a field experiment. Information Economics and Policy, 24(3–4), 243–253.
Kaaya, G. B., & Waiganjo, E. (2015). Factors affecting women enrollment in technical institutions in Tanzania: A case study of Arusha Technical College. International Journal of Scientific and Technology Research, 4(6), 12–14.
Khanna, G. (2020). Does affirmative action incentivize schooling? Evidence from India. Review of Economics and Statistics, 102(2), 219–233.
Kingdon, G. G. (2005). Where has all the bias gone? Detecting gender bias in the intrahousehold allocation of educational expenditure. Economic Development and Cultural Change, 53, 409–452.
Kosha, A., Oriya, S., Nabi, T., Halim, S., Hofyani, S., Liwal, A., & Noormal, B. (2014). The resilience of women in higher education in Afghanistan. Resilience in Education Settings (RES)-Research Studies Series. World Bank.
Kuglen, C., & Kumar, S. (2017). Gender disparities in higher education enrolment: A comparative analysis. Journal of Higher Education, 28(2), 45–60.
Makoye, J. N. (2003). Strategic issues in ICTE implementation in schools and teacher colleges: The Tanzanian Context. The Tanzania Education Journal, 23(22), 22–33.
Niu, L. (2017). Family socioeconomic status and choice of STEM major in college: An analysis of a national sample. College Student Journal, 51(2), 218–312.
Nwojiewho, D. I., & Deebom, T. M. (2017). Gender disparity towards students enrolment in technical education in rivers state: Causes, effects and strategies. International Journal of Research-Granthalaya, 31(10), 1–10.
Periodic Labour Force Survey (2017–2018). Published by Ministry of Statistics & Program Implementation, National Statistics Office.
Rammohan, A., & Vu, P. (2018). Gender inequality in education and kinship norms in India. Feminist Economics, 24(1), 142–167.
Ranahasan, M. A. (2006). Under-representation of disadvantaged classes in colleges: What do the data tell us? Economic & Political Weekly, 3791–3796.
Sinha, S. (2008). Identification of educationally backward districts higher education. In Higher education in India: Issues related to expansion, inclusiveness, quality and finance (pp. 56–78). University Grants Commission.
Song, L., Appleton, S., & Knight, J. (2006). Why do girls in rural China have lower enrollment? World Development, 34(9).
Sundaram, K. (2006). On backwardness and fair access to higher education. Economic & Political Weekly, 41(50), 1639–1653.
Swain, J. (2022). A review of literature on gender disparity in higher education system in India. International Journal of Research Trend and Innovation, 7(3), 22–25.
Thasniya, K. T. (2014). Girls’ higher education in the era of globalization: Issues of access and quality. International Journal of Education and Psychological Research, 3(4), 18–21.
Tilak, J., & Mazumder, P. K. (2016). Inequality in access to higher education in India between the poor and the rich. An Analysis of 64th and 71st Rounds of NSSO Data (pp. (pp. 5173–5182) [Working Paper]. Council for Social Development.
Tilak J. B. G., Choudhury P. K. (2019). Inequality in access to higher education in India between the poor and the rich: An analysis of the 64th and 71st Rounds of NSSO Data (2007–08 and 2013–14). (Working paper CSD-2/2019). New Delhi, India: Council for Social Development.
Weisskopf, T. E. (2004). Impact of reservation on admissions to higher education in India. Economic & Political Weekly, 39(39), 4339–4349. https://doi.org/10.1177/2455328X221129453.
