
Journal of Development Research

 Search

Rinku Manocha
1 Department of Commerce, Hindu College, University of Delhi, Delhi, India

Creative Commons Non Commercial CC BY-NC: This article is distributed under the terms of the Creative Commons Attribution-NonCommercial 4.0 License (http://www.creativecommons.org/licenses/by-nc/4.0/) which permits non-Commercial use, reproduction and distribution of the work without further permission provided the original work is attributed.
Trading blocs are expanding their coverage and spectrum. Hence, along with trade liberalisation, areas such as liberalised domestic policies, strong infrastructure platforms and less stringent structural set-ups are gaining popularity among various newly negotiated trade agreements. With such support, trade blocs are not only contributing towards stimulating trade but also encouraging investment/foreign direct investment (FDI) flows (and stock) among member countries. Further, following the European Union trends, the Asian continent is emerging as a web of trade blocs. This study is an attempt to empirically examine the impact of three trading blocs (ASEAN/APTA/SAARC) on FDI flows and FDI stock over a period of 12 years via a panel regression framework augmented with gravity model specifications. The results for FDI stocks were found to be more captive. The results for ASEAN suggested that members of ASEAN are significantly attracting FDI stock both from intra-bloc and extra-bloc countries. Results for Asia Pacific Trade Agreement (APTA) found that APTA members are attracting FDI stocks from intra-bloc and extra-bloc economies, but the coefficient was not significant. However, the results suggest that SAARC countries still need to work towards attracting FDI stocks from Asian economies.
RTA, FDI, ASEAN, APTA, SAARC
Introduction
On the world map, the emergence of regional trade agreements (RTAs)/trading blocs has significantly contributed to a multilateral trading system. RTAs are negotiated with an intent to build, strengthen and boost trade flows among member economies. OECD (2001) defines a regional trading agreement as ‘an agreement among governments to liberalize trade and possibly to co-ordinate other trade-related activities’. Economies across the globe are entering into regional integrations to minimise (and even eliminate) tariff and non-tariff-related bars (or barriers) to ease the flow of goods, services and other factors of production. With the new era of regionalism, RTAs are also enlarging the spectrum of their coverage. The existing RTAs are expanding and new RTAs are diversifying to cover areas such as services, agriculture, environment, and investment Hence, the rise in the quantum and stretch of RTAs has stimulated the flow of trade and investment among the member nations. While negotiating a new era of RTAs, economies try to liberalise domestic policies, remove structural bottlenecks, promote compactable environment and provide infrastructural support which helps in stimulating the flow of investment, goods and services.
Talking about foreign direct investment (FDI) flows and RTAs, a new era of RTAs is stimulating investment flows both directly and indirectly among the countries within the bloc. A number of RTAs are directly negotiating investment-related provisions as part of existing RTAs and, hence, are providing a direct route/channel that stimulates investment among members of a bloc. However, some RTAs indirectly support FDI inflows among member countries as they come up with intent and policies that remove structural hindrances and strengthen the investment-related environment. Further, RTAs provide a signalling effect (Kaushal, 2022) and play a catalytic role among member economies, hence providing shared complementarities (Paul, 2017) to industries that stimulate investment among member economies. Chakraborty et al. (2019) suggested that trading blocs and economic integration policies are deepening global value chains, production processes and distribution networks in the Asian subcontinent.
Impact of Trade Blocs on Investment
FDI is generally defined as having control over a business organisation operating in an economy by an entity established in a non-native nation. There are two major classifications of FDI (investment), namely, horizontal FDI and vertical FDI. Horizontal FDI can be seen when the home country enlarges market size by entering the host economy, whereas vertical FDI can be reported where the home economy establishes production processes in the host economy to boost benefits associated with cheaper cost of production. RTAs might have direct/indirect impacts on the horizontal as well as vertical investment coming from non-native economies. Therefore, to study the impact of regional blocs (RTAs) on investment, it becomes essential to chalk down the relationship between trade, investment and RTA.
Horizontal FDI
Before entering an RTA, countries (both home and host) have high trade barriers, and hence, the home country may face problems associated with a high cost of serving the host economies via trade. This encourages the home economies to jump the tariff structure and establish foreign affiliations in the host countries (go for horizontal FDI). However, when the home and the host economies agree to form an RTA, servicing the market via trade/export as trade becomes cheaper as a result of RTA formation leading to an end of tariff jumping effects, thus discouraging horizontal FDI and facilitating new trade among member countries of the RTA so formed.
However, the above-mentioned impact is seen only if the products are identical, and the cost of production is the same in both economies. However, if the products manufactured in both countries are heterogeneous (and not homogeneous) and are produced by taking advantage of locational factors of production, then in such case, horizontal FDI cannot be substituted for trade. Therefore, the formation of RTA may promote investment, hence leading to an extended market impact. Hence, RTAs act as mechanisms to liberalise and, hence, facilitate a compatible environment among members, which in turn acts as a strengthening/encouraging platform for investment.
Vertical FDI
International vertical integration effects can be seen when goods are produced in a host country where labour abundance or technical know-how is available, and the market for the final product is available in both the home and host countries. The emergence of RTAs leads to a reduction in trade barriers (for goods, services and other factors of production) and encourages vertical FDI among members. Hence, the creation of RTAs leads to investment creation among member nations.
Moreover, in the recent past, RTAs negotiated incorporating norms for investment liberalisation, compatible policies (such as domestic regulation norms, market access norms; property rights, stable trade policies and service sector reforms) and cross-border dispute settlement, which further facilitates investment along with trade (Yeyati et al., 2002) among members of an RTA. Even some of the blocs are explicitly entering into investment agreements that strengthen the flow of FDI among member nations and, hence, promote investment creation. In such cases, members of an RTA become a better destination for FDI and, subsequently, make non-members relatively less attractive leading to FDI (investment) diversion.
Literature Review
An insight into the existing literature depicts that few Asian studies have examined the intra-bloc FDI flows and direction of investment flows within a bloc. Rammal and Zurbruegg (2006) empirically examined the impact of regulatory quality of intra-FDI flows for ASEAN economies. Similarly, Sahu and Dash (2021) examined the intra-FDI flows for five ASEAN economies and concluded that resource-seeking and efficiency-seeking motives of multinational corporations are driving forces of FDI in ASEAN countries. Similarly, Dang and Nguyen (2021), studying FDI inflows for ASEAN-7 economies suggested that significant contributions of policy-makers and institution quality in ASEAN developing economies are enhancing FDI inflow in the ASEAN market. Few studies have also examined FDI flows among SAARC countries. Hamid et al. (2023) examined FDI flows for SAARC economies over the period of 1996–2017 and found that political stability and government effectiveness contribute to FDI in SAARC nations. Srinivasan (2011) also examined the FDI inflows for SAARC countries over the tenure of 1970–2007, and suggested that more open-door policies and better infrastructural facilities will support FDI flows among SAARC countries.
However, we were able to have our hand on a few studies that not only have examined intra-bloc FDI flows but have also empirically examined the impact of RTA membership on FDI flows, and empirically examined the association between RTA and FDI flows. Studies examining the association between RTA and FDI were either RTA-specific studies or studies that have examined RTAs as a determinant of FDI flows/stocks among countries. Hence, this study divides the literature discussion into two sections, namely, the studies that have discussed the FDI flows within a specific RTA (trading bloc) and the studies covering RTA as a determinant in FDI stock/flows among member countries. Starting with studies that have captured FDI flows with a specific trade bloc, Park and Park (2008) examined the impact of RTA membership on FDI flows for East Asian blocs (ASEAN, ASEAN+3, ASEAN-Korea, ASEAN-Japan) from 1982 to 1999 by employing extended gravity model via random and fixed effects (FE) regression specification. The results suggested that RTA membership along with reforms is a key factor in attracting FDI in the East Asian region. Thangavelu and Narjoko (2014) also examined the impact of the ASEAN trade bloc on FDI flows over the period of 2000–2009 by employing gravity specification and found that FDI flows have a significant association with ASEAN membership. However, Fatema (2014) empirically examined the impact of the ASEAN investment area (AIA) by employing gravity specification over the tenure of 1990–2012. However, the results suggested that AIA has not significantly contributed to intra-FDI flows among the ASEAN countries. The impact of EU membership on FDI inflows among EU members was also examined by a few researchers. Baltagi et al. (2008) employed HAC estimation for the period of 1989–2001 to examine the impact of EU membership on FDI flows. The study suggested the positive impact of European agreements on bilateral FDI in Europe. Moreover, the estimation found relocation of FDI from Western European countries to Eastern European countries. Otieno et al. (2013) examined the impact of the East African Community (EAC) on intra-FDI flows by using generalised least square (GLS). The study concluded that non-significant results for EAC membership and FDI flows. Ullah and Inaba (2014) evaluated the panel regression model from 2001 to 2010. The study examined FDI flows in the ASEAN and SAFTA regions (using 9 Asian host economies and 23 source economies). The study found the coefficient for ASEAN and ASEAN-Japan to be positive but insignificant, whereas the results for SAFTA were found to be significant and negative. Kumar (2022) qualitatively evaluated the association between RTA (SAARC trading bloc) and intra-FDI flows from 1998 to 2017. The study suggested that SAARC economies need to take progressive steps towards regional integration to boost cross-border investments.
Literature capturing RTAs as a determinant for intra-FDI flows (and stock) among members of a bloc was also identified. Yeyati et al. (2002) studied the determinants for bilateral FDI stocks for 20 OECD source countries to 60 OECD/non-OECD countries over the period of 1982–1998 by employing gravity specification. The study suggested that common free trade agreements (FTA) membership had a positive impact on bilateral FDI stock and, on an average, FDI stock doubles as a result of FTA membership. Similarly, Jang (2011) examined the determinants of intra-FDI flows among 30 OECD and 32 non-OECD countries over the period of 1982–2005 using a regression framework. The results suggested that bilateral RTA affects FDI negatively in the case of intra-OECD countries and positively in the case of extra-OECD countries. Jaumotte (2004) examined intra-FDI flows for 71 developing economies to study the impact of RTAs on FDI flows over the period of 1980–1999 by employing regression analysis. The results suggested that the creation of RTA boosts competition among member nations, leading to improvement in their domestic investment climate and, hence, better returns of RTA formation are reported. Medvedev (2006) employed a sample of 143 countries to study the association between RTA and FDI flows. The results suggested that deeper integration of regional blocs is more significantly associated with net intra-FDI flows for the said countries.
Velde and Bezemer (2006) examined the association between FDI flows and trading bloc membership for the United Kingdom and the United States to developing economies over the period of 1980–2001 by employing the regression framework. The results stated that trade blocs (CARICOM, ASEAN, ANDEAN and NAFTA) attracted more extra-regional FDI for the United Kingdom and the United States. Bae and Jang (2013) examined the impact of FTAs on intra-FDI flows for Korea and 184 partner economies over the period of 2000–2010 and employed country-pair FE for empirical examination. The results suggested that FTAs have encouraged FDI in Korea mainly through high-income countries for the vertical type of FDI. Bengoa et al. (2015) also examined the RTA variable for intra-FDI flows for 11 Latin American economies from 1996 to 2012 by employing ordinary least square, FE, random effects (RE) and Hausman–Taylor estimation. RTA variables were found to be positive but insignificant for FDI flows. Deger et al. (2013) examined FDI flows for 60 host economies with RTA impact using FE, RE and Hausman–Taylor estimation over the period of 1985–2006. The study found a more significant impact of RTA for the inter-OECD region rather than the intra-OECD region.
The review of the existing literature exhibits that various studies have addressed the impact of regional blocs on FDI flows using varied sample size, blocs and empirical tools to study the impact (and presence) of RTA among investing partners on the FDI flows/stocks. A brief note of the literature suggests that few studies (Fatema, 2014; Park & Park, 2008; Thangavelu & Narjoko, 2014) have examined the impact of East Asian blocs on intra-bloc FDI and a few (Kumar, 2022; Ullah & Inaba, 2014) have studied the association between South Asian blocs and intra-FDI flows, but we could not find any study that has empirically examined the impact of regional trading blocs on intra-FDI flows of South, South-East, East Asia (as a whole). Therefore, the focus of the current study was to empirically evaluate the impact of major RTAs of Asia (ASEAN, APTA and SAARC trading bloc) on investment flows.
Further, we could identify that most of the studies have employed panel regression analysis augmented with gravity model to study the impact of RTA on investment flows/stocks and, hence, this study also examines the impact of RTAs (select Asian blocs) on investment flows using gravity framework.
Rationale of the Study
Following the world trend, the Asian region is also actively participating in the formation of RTAs, as a result a web of trade agreements has emerged in the region. As the Asian economies are opening trade doors for RTA members, RTAs are not only providing benefits of trade to the member countries but also facilitating investment liberalisation among members. Therefore, the study is an attempt to measure the investment creation (and diversion) as a result of membership in the major trade blocs (ASEAN, APTA and SAARC) of Asia.
Further, large numbers of studies have covered the impact of regional economic integration on trade but not many have looked upon the investment impact, particularly for Asian economies. Therefore, this study empirically examines whether the economies of South–South Asia, South-East east Asia and East Asia can enhance the intra-regional FDI by promoting (or even by reviving the existing) RTAs. While existing studies for the Asian subcontinent examine the impact of individual RTAs in the region, our study will be an integrated approach empirically examining the investment effects for three major RTAs (ASEAN, SAARC and APTA) in the region of South, South-East and East Asia.
Research Methodology
The study captures whether the formation of regional economic integrations in South, South-East and East Asia helps in attracting investment in the region.
Data and Sample Size
Based on the data available, home countries covered to empirically examine the impact on investment flows and investment stocks in the Asian region are as follows: Bangladesh, Cambodia, China, Hong Kong, India, Indonesia, Japan, Republic of Korea, Lao People’s Democratic Republic, Malaysia, Nepal, Pakistan, the Philippines, Singapore, Sri Lanka, Thailand and Vietnam.
The Asian home economies captured are as follows: Bangladesh, Brunei Darussalam, Cambodia, China, Hong Kong, India, Indonesia, Republic of Korea, Lao People’s Democratic Republic, Macao, Malaysia, the Maldives, Nepal, Pakistan, the Philippines, Singapore, Sri Lanka, Thailand and Vietnam. Either due to the non-availability of data or no investment flow along some of the Asian economies (Brunei Darussalam, Macao), the reciprocal flow of investment is missing. Therefore, the study empirically estimates the effect of RTAs on investment flows in a sample of about 17 home and 19 host (South, East and South-East Asian) economies for a period of 12 years (2003–2014) using the gravity model. The study has 1,824 (152 pairs) yearly observations for yearly bilateral inward investment stock among the countries under consideration. However, the sample size for FDI inflows for host countries was the same except for Nepal due to the non-availability of data. The data for FDI inflows capture 143 pairs and 1,716 yearly observations for the period of 12 years (2003–2014) (sample size limitation due to the non-availability of bilateral FDI data).
Data Source
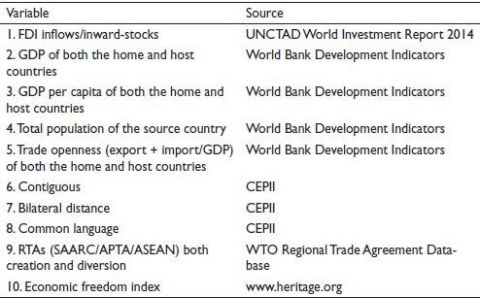
The sources of data have been listed in Table 1.
Methodology
Our methodology uses gravity model specification to estimate the investment creation and investment diversion effects of RTAs. In the existing literature, the specifications for the gravity model covering FDI (investment) have studied either the horizontal aspect or the vertical aspects or both. Our study captures both horizontal motives (market size) and vertical motives (factor endowment) simultaneously as part of a single regression framework. So, we have used the extended gravity model—Knowledge capital model (also known as the CMM model) for FDI covering investment and trade costs. CMM was given by Carr et al. (1998) covering both horizontal attraction and vertical motivation.
Table 1. Sources of the Data.
Gravity Model for Investment
A large number of empirical studies evaluate the gravity model for investment by using bilateral FDI stocks/flows as a dependent variable. Investments are generally reported based on both stock and flows. Flow is a variable which covers the impact over a period, whereas stock is a variable which captures at a point in time. Both FDI stock and FDI flows have limitations and advantages. Coupet and Mayer (2007) and Subasat and Bellos (2011) suggest that working with FDI stock rather than flows has certain advantages. For example, stocks are more stable than flows and measure capital ownership better as they involve FDI that is financed in local capital markets. However, Globerman and Shapiro (2002) suggested the use of FDI flows, as the calculation of FDI stock is not homogeneous across countries. Since we are also using panel data with different source countries, it would be advisable to use FDI flows to avoid heterogeneity across countries. Hence, this study is an attempt to examine the impact of RTAs on both FDI inflows and FDI inward-stocks with two different regression specifications. The functional form of our gravity model for investment inflows/inward-stocks capturing investment creation/diversion can be stated as follows:
FDI inflows/FDI inward-stocks = f(market size, skill difference, trade openness of home country, trade openness of the host country, population of home country, population of host country, common border, common language, distance, domestic economic index, SAARC investment creation, SAARC investment diversion, APTA investment creation, APTA investment diversion, ASEAN investment creation, ASEAN investment diversion).
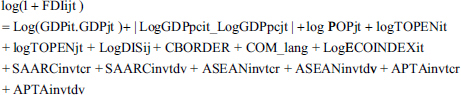
We use a double log model for panel data regression to analyse the determinants. The data for some of the observations of FDI bilateral inflows/inward-stock were missing. To accommodate zero observations, we follow the existing protocol of expressing the dependent as log (1 + FDI) (Eichengreen & Irwin, 1995; Rajan, 2008; Stein & Daude, 2007). Generally, a smaller value or 1 is added to the existing FDI flows/stocks to take care of zeros or missing values in the dependent variable. The basic regression equation used in the study is as follows:
where FDIijt is bilateral FDI stock/flow between countries i and j,
i = the host (destination) country and j the home (source) country,
GDPit = the nominal GDP of the host country i,
GDPjt = the nominal GDP of the home country j,
GDPpcit = the per capita GDP of the host country i,
GDPpcjt = the per capita GDP of the home country j,
DISijt = the distance between the home and the host country,
POPjt = the population of the home country j,
TOPENit = trade openness of the host country i,
TOPENjt = trade openness of the home country j,
CBORDERijt = dummy variable with value 1 if both the countries i and j are sharing a common border (contiguous) otherwise 0,
COM_Langijt = dummy variable with value 1 if both the countries have linguistic proximity otherwise 0,
ECOINDEXjt = the domestic economic index of host country i for the given year t,
SAARCinvtcr = dummy variable with value 1 in case both the countries were partners of the SAARC trading bloc for the given year t, otherwise 0,
SAARCinvtdv = dummy variable with value 1 in case the home country belongs to SAARC trading bloc for the given year t, otherwise 0,
APTAinvtcr = dummy variable with value 1 in case both the countries were partner of the APTA trading bloc for the given year t otherwise 0,
APTAinvtdv = dummy variable with value 1 in case the home country belongs to APTA trading bloc for the given year t otherwise 0,
ASEANinvtcr = dummy variable with value 1 in case both the countries were partner of the ASEAN trading bloc for the given year t otherwise 0,
ASEANinvtdv = dummy variable with value 1 in case the home country belongs to ASEAN trading bloc for the given year t otherwise 0,
Following the existing literature for gravity specification (Binh et al., 2014), this study incorporates trade cost variables such as distance, common border and common language as control variables.
A Brief Explanation of Explanatory Variables
Sum of the GDP of both the home and host economies (extended market)
The combined GDP of both the home and host countries indicates an extended market available to the investing country. Countries with relatively larger markets attract more and more investors. The study employs the sum of GDP of both countries in order to capture the enlarged market size (Resmini & Siedschlag, 2008). The coverage of the variable is like the variable examined by Park and Park (2008) and Bae and Keum (2013) to measure the impact of the extended market size on FDI. The variable is expected to be positive in case the host economy acts as an extended market for the home economy attracting horizontal investments.
Absolute difference between GDP per capita of home and host country
The study captures the difference in the labour productivity (SKILL) difference by examining the absolute difference between per capita income (GDP per capita) of both the home and host countries (the vertical FDI drive). The difference in the GDP per capita measures the labour cost difference between the economies. To capture the factor endowment some of the existing studies, Park and Park (2008) and Cardomone and Scoppola (2012) have examined the differential between the skill level (generally school-level enrolment). However, due to a lack of data for school enrolment for a large number of economies, the study was not able to capture skill differential with respect to school enrolment ratio.
Some of the studies (Jang, 2011; Resmini & Siedschlag, 2008) captured SKILL as an absolute difference between GDP per capita between both economies. Our study follows a similar gauge for the SKILL differential. The absolute difference between GDP per capita of the home and the host country captures the vertical FDI drive. The variable is expected to be positive if the Asian region is able to attract FDI from economies which have no absolute difference with respect to GDP per capita. However, in case Asian economies are attracting more investment from countries which have substantial GDP per capita differential, then the variable will bear a positive sign.
Distance
Distance between the home and the host explains whether geographical proximity between both countries is attracting FDI or not. Distance is largely associated with transportation costs. However, in the case of FDI as the dependent variable, the impact of distance will vary depending upon the type of FDI (Egger, 2008; Kayam & Hisarciklilar, 2009). If the motive is to achieve production efficiency (vertical FDI) then the lesser the distance, the more the flow of investment. For market expansion (horizontal FDI) larger distance will promote investment to the destination economy. The tendency to capture the market by enhancing trade increases with lesser distance. Therefore, the impact of the variable is ambiguous.
Contiguous (common border)
The variable captures whether economies sharing a common border help in attracting investment among investing countries. The study attempts to evaluate whether countries nearby have less serving cost. Fratianni and Oh (2009) found that a common border between the home and host countries was positively and significantly attracting FDI. To capture the impact of the variable, the study employs a dummy variable with a value of 1 if both countries share a common border, otherwise 0.
Common language
A common language between the home and host countries helps the investing country in reducing communication (and interpretation) costs. Sharing a common language is indicative of the cultural similarity between both countries. Language skill and cultural similarity help in facilitating FDI among nations. Lesher and Miroudot (2006) found common official language significant and positive for investment flows. The study incorporates common language as a dummy variable with value 1 in case both countries share an official common language otherwise 0. According to CEPII (French Research Centre for International Economics), countries are officially said to share a common language if a language is spoken by at least 9% of the population in both countries.
Population of the home country
The study captures the physical size of the home country by including the population of the country from which FDI is received. The variable captures whether countries with a larger size of populations will be providing FDIs to other economies. In case the population in the home country is looking for self-sufficiency, then a larger size of the population in the home country will discourage FDI outflows in case investment is market seeking. Moreover, a country with a larger population will support domestic production in case the FDI is market seeking. So, in such case, FDI and population will be negatively related. The impact of the variable is ambiguous.
Trade openness of host and home countries
The study captures trade openness to examine the impact of trade liberalisation measures of home and host countries on FDI inflows/inward-stocks in the Asian region. Openness has been examined as a percentage of trade (export + import) over GDP. Countries come up with policies and measures to support liberalisation and such efforts ease the flow of trade and investment across economies. Krishnankutty (2010), Resmini (2000) and Nunes et al. (2006) found positive and significant results for trade openness and FDI.
Economies having stringent tariff policies promote market-seeking FDI with tariff jumping tendency and when the economies liberalise, such market-seeking investment gets demotivated. Studies such as Akenbor and Tennyson (2014) and Liu (2006) found a negative and significant relationship between FDI and trade openness. Therefore, the impact of the variable is ambiguous.
Similarly, the impact of trade liberalisation of the home country on investment flow can also be measured by incorporating trade openness of the home economy and whether the policies or measures of trade liberalisation of the home countries are supporting the outflow of investment to the Asian region.
Domestic economic freedom index of the host country
In order to capture the domestic environment of the host economy, the study incorporates the domestic economic index. Park and Park (2008) examined the economic Freedom Rating compiled by the Fraser Institute for capturing domestic reform as a determinant of FDI. This study applies the economic freedom index provided by the Heritage Foundation1 in order to examine the whether the domestic environment of the host economy is supportive towards FDI inflows. The index provides comparative scores country-wise and covers areas such as property rights, freedom from corruption, fiscal freedom, government spending, business freedom, labour freedom, monetary freedom, trade freedom, investment freedom and financial freedom. The index has been incorporated to examine the business and investment climate in the host country. We expect the variable to have a positive and significant impact on Asian FDI inflows.
Investment creation variables (SAARCinvtcr/APTAinvtcr/ASEANinvtcr)/intra-bloc investment
The study incorporates RTA dummy variables to examine the investment creation (intra-bloc investment) impact of three significant RTAs in the region of South, East and South-east Asia, namely, SAARC, APTA and ASEAN. RTAs bring a strong economic bond between the member nations which stimulates a liberal environment, mutual compatible policies and favourable treatment. This supports not only trade but also investment among member nations. The study includes three RTA dummy variables to examine the impact of SAARC, APTA and ASEAN trading blocs, namely, SAARCinvtcr, APTAinvtcr and ASEANinvtcr. The value of the variables is 1 in case both the home and host countries are part of the regional bloc for the given year t, otherwise 0. We expect the coefficient of the variable to have a positive impact on the investment flow in the region.
Investment diversion variables (SAARCinvtdv/APTAinvtdv/ASEANinvtdv)/extra-bloc investment
The variable has been included to examine whether Asian region is receiving investment inflows/inward stocks from countries which are not part of the regional blocs (extra-bloc) (SAARC/APTA/ASEAN). In case the trading blocs are aiding the member nations to stimulate investment among them and are reducing (diverting) investment from non-members, then the coefficient for investment diversion will bear a negative coefficient. The value of the variable/s is 1 in case the host country belongs to the trading both for the given year t, otherwise 0.
Research Methodology
Due to the two-dimensional nature of the data, the study applies panel regression. The existing literature depicts the use of various statistical tools for capturing the RTAs on investment. The studies capturing the impact of regional trading blocs generally need to control bilateral specific effects; therefore, FE specification and RE specification have been intensively used. Bengoa et al. (2015) and Deger et al. (2013) analysed the FDI pattern using FE, RE and Hausman–Taylor estimation. Subasat and Bellos (2011) and Hossain (2015) apply RE with GLS corrected for heteroskedasticity and autocorrelation to examine the impact on investment. Hill and Menon (2014) analysed FDI inflows within countries by applying the FE model. Cardamone and Scoppola (2012) and Berger et al. (2009) applied FE and dynamic GMM along with other model specifications. Medvedev (2006) and Park and Park (2008) examined FDI using RE as well as FE specifications. As a large amount of data for bilateral FDI (dependent variable) are reported as zero, some of the studies have also applied the Tobit regression model (censored regression) along with other model specifications (Bae & Jang, 2013; Leshier & Miroudot, 2006; Ullah & Inaba, 2014).
Fixed Effects, Random Effects and Hausman–Taylor Estimation
Panel data can efficiently be examined using FE and RE specifications. But both have certain pros and cons. Fixed effect specification correlates individual specific effects with explanatory variables but time-invariant variables cannot be examined using FE. REs randomly draw individuals from a large sample without correlating the individual effects with independent variables. But time-invariant variables can be efficiently captured using RE. However, the choice between RE and FE depends upon the results of the Hausman test. Apart from FE and RE estimations, Hausman–Taylor estimation is also popularly employed to examine the explanatory variables, particularly when both time-variant and time-invariant variables are simultaneously examined.
Tobit Regression
In case the entire range of values for the regressands is not available (or reported), but the data for explanatory variables are available, then a censored regression model, say, the Tobit regression model, can be applied to explain the impact of explanatory variables (Gujarati, 1995). Yeyati et al. (2003) applied the Tobit regression model to accommodate the zeros in FDI flows in order to examine regional integration and FDI.
The study captures the results generated by HT estimation and Tobit regression model for interpretation. The results for RE are reported just for comparison.2 HT estimation takes care of time-invariant variables and cross-sectional variations, therefore, the results reported by HT estimation have been shown. As discussed, the dependent variable is reported as log (FDI+1)3 both for HT estimation and Tobit regression model.
Results and Analysis
Results for FDI Inward Stock as Dependent Variable
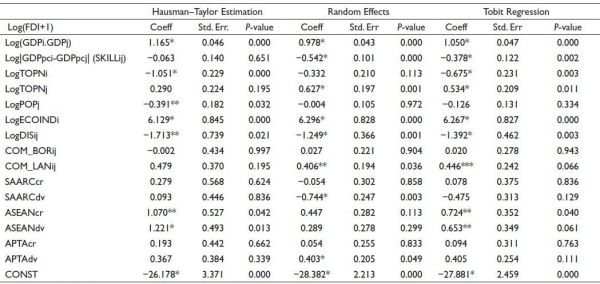
Table 2 depicts the results for FDI inward-stocks as the dependent variable. The results for market size are found to be highly significant and positive. This indicates that Asian economies are offering larger markets to the home economies to invest. This implies that the Asian region is definitely promoting horizontal FDI (market seeking). The results for the differential in GDP per capita are found to be negative and significant (for RE as well as Tobit regression model). The results indicate in case the GDP per capita of host and home countries differs substantially, the Asian countries are not able to attract vertical investment in the region.
The results for the trade openness of the host country are found to be negative and significant. This indicates that trade liberalisation policies in the region discourage investment. Liberal trade policies in the region promote trade (import) in the region and dilute tariff jumping need of FDI. However, the results for trade openness of the home country are found to be insignificant (significant only under the Tobit regression model) but positive. This implies economies with liberal policies are investing more in Asian regression. The coefficient for the population size of the home country is found to be insignificant (significant only under HT estimation) but negative. This indicates countries with a larger population size would like to go more for an absorption strategy rather than making investments offshores. The results for the economic freedom index of the host country were found to be significant and positive. This suggests countries with better domestic environments are able to fetch more FDI inflows.
Table 2. Estimates of the Gravity Model for FDI Inward Stock as Dependent Variable. (Results for the Period 2003–2014 for 17 Economies)
Note: *, ** and *** indicate statistical significance at 1%, 5% and 10% levels, respectively.
The results for time-invariant variable, distance, are found to be negative and significant. This suggests with lesser distance more flow of investment and, hence supporting vertical FDI. The results for a common border are found to be insignificant. The results for common language suggest more investment slide among nations that have linguistic proximity. The results for variables of our interest, three regional trading bloc (SAARC/APTA/ASEAN) variables are not uniform. The results for intra-SAARC investment creation were found to be positive but insignificant. The results depict that SAARC trading bloc is just facilitating investment among member nations and not a major determinant of investment. The results for SAARC investment diversion are also found to be insignificant. As the sample size for home countries was capturing economies in the Asian region, results for SAARC creation and diversion indicate that SAARC countries do not receive a major share of its investment from Asian economies. The results for ASEAN investment creation and ASEAN investment diversion were found to be quite encouraging. Both ASEAN investment creation and ASEAN investment diversion were found to be positive and significant. This indicates that ASEAN economies are receiving investment both from ASEAN as well as non-ASEAN economies. The results for APTA investment creation were found to be positive but insignificant. The results for APTA investment diversion are found to be positive and insignificant for HT estimation but nearer to significant under the Tobit model (and significant for RE). The results for APTA suggest that intra-APTA investment movement is not significant (just a promoter) but APTA countries are getting investments from other Asian home economies.
Results for FDI Inflows as Dependent Variable
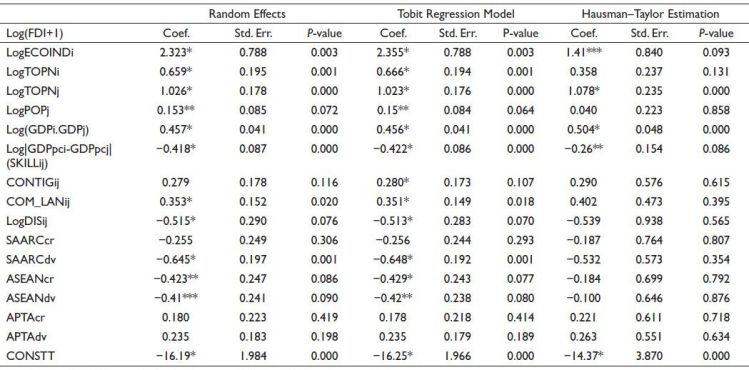
The results for FDI inflows as a dependent variable are depicted in Table 3. The results for extended market size (sum of GDP of both the host and home economies) are found to be significant and positive. This indicates the extended market is a pull for investment flow in the Asian region. The results for GDP per capita differential were found to be significant but negative, suggesting a lack of attraction towards FDI inflows between economies with a differential in GDP per capita. The results for trade openness for FDI inflows were not similar to FDI inward-stock. Both the trade openness of the home and host countries was found to be positive and significant. This indicates liberal trade policies are stimulating FDI flows in the region. The results for the economic freedom index of the host country were also found to be significant and positive. The economies with better domestic, investment, financial and macro policies are better destinations for investment.
The results for distance, common border and linguistic proximity bear the expected sign and are significant (HT estimation results are insignificant but with expected sign). This indicates that countries with lesser distance and cultural similarity are able to fetch more FDI inflows and save information-related costs. The physical size (population) of the home was found to be positive and significant. This indicates larger FDI inflows from countries with a larger population size.
For FDI inflows as a dependent variable, the results for SAARC investment creation were found to be insignificant and negative, indicating no intra-SAARC investment flow among SAARC countries. The results of SAARC investment diversion were also found to be negative and significant (insignificant only for HT estimation). The results indicate that SAARC nations are neither getting investment flows from SAARC nations or from non-SAARC Asian nations. The results for ASEAN investment creation and investment diversion are similar to the results generated for SAARC trading bloc. Hill and Menon (2014) also found intra-ASEAN insignificant for FDI inflows as a dependent variable. However, the results of APTA investment creation and APTA investment diversion are found to be positive but insignificant. This implies APTA nations are getting investments from both APTA countries as well as non-APTA Asian countries but not significantly.
Table 3. Estimates of the Gravity Model for FDI Inflows as Dependent Variable. (Results for the Period 2003–2014 for 17 Economies)
Note: *, ** and *** indicate statistical significance at 1%, 5% and 10% levels, respectively.
Conclusion
The results for FDI inflows and FDI inward-stock were quite divergent. Such results might have been due to the basic difference between the FDI flows and FDI stocks. Flows are recorded over a period (annually) and stocks are reported at a point of time (accumulative concept). FDI stock at the end of a period is generally derived as FDI stock at the beginning of the period plus FDI flows plus price change plus exchange rate changes plus other adjustments (Duce, 2003). The results for FDI stock depict the impact of explanatory variables on accumulated investment whereas the outcomes for FDI inflows are reflectors of annual or yearly attraction of investment in the region.
The results for FDI stock show a favourable outcome for extended market variables. However, countries with differential in GDP per capita are not able to attract investment in the region. Trade openness of the home country discourages investment as tariff barriers are reduced with liberal trade policies. Results for the economic freedom index, common language, lesser distance and trade openness of the host economy are found to be positive and encouraging. Moreover, regional variables are promoting inward FDI in the Asian region. The results for all three RTA (SAARC/APTA/ASEAN) creation variables are found to be positive but the results for ASEAN are found to be most encouraging. Results for SAARC investment diversion show a negative coefficient for two out of three models. The results suggest that SAARC nations do not get major (significant) FDI from the Asian region whether SAARC members or non-SAARC members. However, the results for ASEAN investment diversion are found to be positive, indicating Asian economies are investing more in the ASEAN bloc. Park and Park (2008) ASEAN economies are attracting FDI inward-stocks both from intra-bloc as well as extra-bloc. The results for APTA investment diversion were found to be positive but insignificant. The study indicated APTA economies are attracting investment both from APTA member and non-APTA Asian economies but not significantly.
The results for FDI inflows are similar for all variables except RTA variables. The results for FDI flows indicate that extended market variables, population, trade openness of home and host countries, lesser distance and language proximity are more significant variables for FDI inflows rather than RTA variables. Results for SAARC and ASEAN investment creation/diversion were found to be negative and insignificant whereas results for APTA were found to be insignificant but positive.
We can summarise by saying that results for investment inward-stocks are more captive as stocks are said to be more stable and have a better assessment of capital holdings.
Future Scope of the Study
This study was an attempt to evaluate the impact of regional blocs (Select Asian) on FDI flows. The coverage of the study was largely towards investment however, future research can be suggested to evaluate the impact of Asian regional blocs on trade flows and service received. Further, a study can also be designed to examine the environmental impact of cross-border trade and investment flows among Asian economies as a result of bloc formation. Lastly, this study incorporated aggregate FDI flows/stocks (country-specific) among Asian economies; however, intensive research can be undertaken with firm-level cross-border flow of investments (firm-level FDI flows) and, hence, can be used as a better insight to evaluate the impact of regional blocs on investment flows.
Declaration of Conflicting Interests
The author declared no potential conflicts of interest with respect to the research, authorship and/or publication of this article.
Funding
The author received no financial support for the research, authorship and/or publication of this article.
Notes
2. Fixed effects where not reported as RTA dummy variables for the period 2002-2014 became time invariant (the sample period).
3. As log(FDI+1) will generate value 0 in case FDI=0.
ORCID iD
Rinku Manocha https://orcid.org/0000-0001-7125-4858
Akenbor, C.O., & Tennyson, O. (2014). Determinants of foreign direct investment in a domestic society: The Nigeria experience. The Business and Management Review, 4(4), 282–294.
Bae, C., & Jang, Y.J. (2013). The impact of free trade agreements on foreign direct investment: The case of Korea. Journal of East Asian Economic Integration, 17(4), 417–444.
Bae, C., & Keum, H.Y. (2013). The impact of FTAs on FDI in Korea. World Economy Update, 3(19), 1–6.
Baltagi, B.H., Egger, P., & Pfaffermayr, M. (2008). Estimating regional trade agreement effects on FDI in an interdependent world. Journal of Econometrics, 145(1–2), 194–208.
Bengoa, M., Sanchez-Robles, B., & Shachmurove, Y. (2015 June 29–30). Latin America’s FDI patterns: A panel data gravity model to assess the role of regional integration agreements. Paper presented at 21st International Panel Data Conference, Central European University, Budapest.
Berger, A., Cochrane, B., & Mitchell, S. (2009). The 2009–2013 research agenda for oncology nursing. Oncology nursing forum. 36. E274-82. 10.1188/09.ONF.E274-E282.
Binh, D.T., Duong, N.V., & Cuong, H.M. (2014). Applying gravity model to analyze trade activities of Vietnam. Journal of International Economics and Management, 69, 3–18.
Cardamone, P., & Scoppola, M. (2012, June 4–5). Trade costs and the pattern of foreign direct investment: Evidence from five EU countries. Paper prepared for presentation at the 1st AIEAA Conference ‘Towards a Sustainable Bio-economy: Economic Issues and Policy Challenges,’ Trento, Italy.
Carr, D.L., Markusen, J.R., & Maskus, K.E. (1998). Estimating the knowledge-capital model of the multinational enterprise. National Bureau of Economic Research working paper No. 6773.
Chakraborty, D., Chaisse, J., & Xu, Q.I.A. N. (2019). Is it finally time for India's free trade agreements? the ASEAN “present” and the RCEP “future”. Asian Journal of International Law, 9(2), 359–391.
Coupet, M., & Mayer, T. (2007). Institutional determinants of Foreign direct investment. Journal World Economy, 30(5), 764–782.
Dang, V.C., & Nguyen, Q.K. (2021). Determinants of FDI attractiveness: Evidence from ASEAN-7 countries, Cogent Social Sciences, 7(1). https://doi.org/10.1080/23311886.2021.2004676
Deger, S., Lam, C., Sen, S., & Voicu, A. (2013, October). Determinants of FDI-impact of natural barriers, regional integration and “behind-the-border” regulatory environment. Paper presented at International Atlantic Association, Annual Conference, Philadelphia.
Duce, M. (2003). Definitions of foreign direct investment (FDI): A methodological note. Banco de Espana. https://www.bis.org/publ/cgfs22bde3.pdf
Egger, P. (2008). On the role of distance for outward FDI. Annual Regional Science, 42, 375–389.
Eichengreen, B., & Irwin, D.A. (1995). Trade blocs, currency blocs and the reorientation of trade in the 1930s. Journal of International Economics, 38, 1–24.
Fatema, H. (2014). Regional integration and intra-regional FDI: The case of ASEAN. (Unpublished masters’ thesis, Department of Economics, Lund University, Sweden). http://lup.lub.lu.se/luur/download?func=downloadFile&recordOId=4394439&fileOId=4394479
Fratianni, M., & Oh, C.H. (2009). Size of regional trade agreements and regional trade bias. Applied Economics Letters, 16(6), 1603–1606.
Globerman, S., & Shapiro, D. (2002). Global foreign direct investment flows: The role of governance infrastructure. World Development, 30(11), 1899–1919.
Gujarati, N. D. (1995). Basic econometrics (3rd ed.). McGraw-Hill, Inc.
Hamid, I., Alam, M.S., Baig, I.A., & Jena, P.K. (2023). Nexus between institutional quality and foreign direct investment inflows: Panel data analysis of SAARC countries. Journal of Knowledge Economy. https://doi.org/10.1007/s13132-023-01252-6
Hossain, M.I. (2015). Intra-regional trade, intra-regional FDI and economic integration: The South Asian perspective. International Journal of Economics, Commerce and Management, III (5), 203–228.
Hill, H. & Menon, J. (2014). ASEAN Commercial Policy: A Rare Case of Outward-Looking Regional Integration, Regional Economic Integration (Asian Development Bank Working Paper No. 144).
Jang, Y.J. (2011). The impact of free trade agreements on foreign direct investment among developed countries. The World Economy, 34(9), 1628–1651.
Jaumotte, F. (2004). Foreign direct investment and regional trade agreements: The market size effect revisited. (Working Paper No. 04/206). International Monetary Fund website: http://www.imf.org/external/pubs/cat/longres.aspx?sk=17770.0
Kaushal, L.A. (2022). Impact of regional trade agreements on export efficiency – A case study of India. Cogent Economics & Finance, 10(1). https://doi.org/10.1080/23322039.2021.2008090
Kayam, S.S., & Hisarciklilar, M. (2009). Revisiting the investment development path (IDP): A nonlinear fluctuation approach. International Journal of Applied Econometrics and Quantitative Studies, Euro-American Association of Economic Development, 9(2). https://econpapers.repec.org/article/eaaijaeqs/v_3a9_3ay2009_3ai_3a1_5f12.htm
Krishnankutty, R. (2010). Testing the relationship between FDI inflow and outflow in India: A critical analysis (No. 48609). University Library of Munich, Germany.
Kumar, J. (2022). Impact of regional economic integration on FDI in SAARC countries. Journal of Accounting and Finance in Emerging Economies, 8(2). https://doi.org/10.26710/jafee.v8i1.2191
Leshier, M., & Miroudott, S. (2006). Analysis of the economic impact of investment provision in regional trade agreements. (Working Paper No. 36). http://search.oecd.org/officialdocuments/displaydocumentpdf/?doclanguage=en&cote=td/tc/wp(2005)40/final
Liu, T. (2006, July 13–14). Empirical study on the impact of regional trade agreements on strengthening China’s FDI. Paper presented at the ACESA 2006 Emerging China: Internal Challenges and Global Implications, Victoria University, Melbourne.
Medvedev, D. (2006). Beyond trade: The impact of preferential trade agreements on foreign direct investment inflows (World Bank Policy Research Working Paper 4065). http://elibrary.worldbank.org/doi/book/10.1596/1813-9450-4065
Nunes, C.L., Oscategui, J., & Peschiera, J. (2006). Determinants of FDI in Latin America Documento De Trabajo 252 of U.S. firms. Journal of International Economics, 33, 57–76.
OECD (2001, December 6). Glossary of statistical terms. http://stats.oecd.org/glossary/detail.asp?ID=3127
Otieno, M., Moyi, E., Khainga, D., & Biwott, P. (2013). Regional integration and foreign direct investment in East African Countries. Journal of World Economic Research, 2(4), 67–74.
Park, I., & Park, S. (2008). Reform creating regional trade agreements and foreign direct investment. Pacific Economic Review, 13(5), 550–566.
Paul, B.R. (2017). Handbook on negotiating sustainable development provisions. In preferential trade agreements. United Nations Publication. https://www.unescap.org/sites/default/files/Handbook%20SD-PTA_final.pdf
Rajan, R.S. (2008). Intra-developing Asia FDI flows: Magnitudes, trends and determinants. In H. Soesastro (Ed.), Deepening economic integration. The ASEAN Economic Community and Beyond-, ERIA Research Project Report 2007-1-2. Chiba: IDE-JETRO, 204–238.
Rammal, H., & Zurbruegg, R. (2006). The impact of regulatory quality on intra-foreign direct investment flows in the ASEAN markets. International Business Review, 15, 401–414. https://doi.org/10.1016/j.ibusrev.2006.05.001
Resmini, L. (2000). The determinants of foreign direct investment into the CEECs: New evidence from sectoral patterns. Economics of Transition, 8(3), 665–689.
Resmini, L., & Siedschlag, I. (2008). Is FDI into China crowding out the FDI into the European Union? (ESRI Papers WP231). Economic and Social Research Institute. http://www.esri.ie/pubs/WP231.pdf
Sahu, J.P., & Dash, S.K. (2021). What explains FDI inflows to ASEAN countries? Evidence from quantile regressions. Journal of Asian Economic Integration, 3(1), 25–37.
Srinivasan, P. (2011). Determinants of foreign direct investment in SAARC nations: An econometric investigation. The IUP Journal of Managerial Economics, 3, 26–42.
Stein, E., & Daude, C. (2007). Longitude matters: Time zones and the location of foreign direct investment. Journal of International Economics, 71(1), 96–112.
Subasat, T., & Bellos, S. (2011). Economic freedom and foreign direct investment in Latin America: A panel gravity model approach. Economics Bulletin 31(3), 2053–2065.
Thangavelu, S.M., & Narjoko, D. (2014). Human capital, FTAs and foreign direct investment flows into ASEAN. Journal of Asian Economics, 35, 65–76.
Ullah, M.S., & Inaba, K. (2014). Liberalization and FDI performance: Evidence from ASEAN and SAFTA member countries. Journal of Economic Structures, 3(6), 1–24.
Velde, D.W. te, & Bezemer, D. (2006). Regional integration and foreign direct investment in developing countries. Transnational Corporation, 15(2), 41–70.
Yeyati, E.L., Stein, E., & Daude, C. (2002). Regional integration and the location of FDI. Inter-American Development Bank Working Paper no. 414. https://doi.org/10.2139/ssrn.1818703
