
Journal of Development Research

 Search
Manisha Vikas Jagtap1
1 Rajarambapu Institute of Technology, Department of Management Studies (MBA), Affiliated to Shivaji University, Kolhapur, Maharashtra, India

Creative Commons Non Commercial CC BY-NC: This article is distributed under the terms of the Creative Commons Attribution-NonCommercial 4.0 License (http://www.creativecommons.org/licenses/by-nc/4.0/) which permits non-Commercial use, reproduction and distribution of the work without further permission provided the original work is attributed.
The foundation of every nation’s economic structure is made up of financial institutions. It consists financial institutions such as banks, credit societies, asset management companies, insurance firms and mortgage lenders. They assist the economy expand by giving their clients financial support and services. One of the key factors in the growth of the national economy is seen as being banks. The current study examines the financial results of the nation’s public and private sector banks in order to comprehend how well the bank makes financial decisions. Moreover, to identify the various factors that affect the bank’s financial stability. The research instrument used is capital adequacy, asset quality, management capability, earnings capacity and liquidity model and t-test. It can be concluded that public sector banks need to focus on strategic decisions for sustaining in the competition with private sector banks. They require to be more professional as like private players in the banking business.
Adequacy, capital, efficiency, financial, performance management, quality
Introduction
The foundation of every nation’s economic structure is made up of financial institutions. It consists financial institutions such as banks, credit societies, asset management companies, insurance firms and mortgage lenders. They assist the economy expand by giving their users financial support and services. It is believed that banks have had a significant role in the expansion of the national economy. The banking sector includes a variety of banks, such as central banks, commercial banks, cooperative banks and specialty banks. They meet the financial needs of the state, businesses and the general public. The central bank of the country has authority over all banks. These banks are required to abide by all rules and regulations established by the central bank. The central bank plays a critical role in preserving the country’s monetary and price stability. It makes several recommendations in this regard for capital requirements, lending standards and reserve needs. The Reserve Bank of India (RBI), the central bank, established a number of policies in India, including minimum standards for capital adequacy, provisions for non-performing assets (NPAs), disclosure requirements, process streamlining, adherence to accounting standards and the transparency of financial statements. In order to align their operations with these criteria, banks re-evaluated their goals, plans, regulations and other procedures that directly impact the health and performance of the bank’s finances. The banks must not only adopt the aforementioned actions but also enhance their financial performance in order to remain competitive. The current study examines the financial results of the nation’s public and private sector banks in order to comprehend how well the bank makes financial decisions, as well as to identify the various factors that affect the bank’s financial stability.
Literature Review
To comprehend the various dimensions of the studies undertaken by various authors, the literature on the performance measurement of financial institutions is studied.
A variety of analyses were presented by Dincer et al. (2011) utilising the CAMELS grading system, which was developed for the Turkish banking sector. The CAMELS approach was mentioned as a type of financial evaluation used to examine banks’ managerial and financial efficiency in order to ascertain their viability and health. Muhammet et al. (2003) talked about the financial performance index for commercial banks. This index makes it simpler to understand how scale and ownership impact bank behaviour. It also shows the effects of financial liberalisation, international migration and the effects of the financial crisis. In this study, financial ratios were employed among other things to reduce inflation-related biases. Angela and Alina (2013) discussed the assessment of the commercial banks in Romania for their financial soundness. With the aim of showcasing their soundness through a few sample indicators that capture the fundamental notions of the six CAMELS framework features, they selected 15 Romanian banking institutions. It appears that each of the selected banks has sufficient capital and is better prepared to sustain any losses as a result of the activity being done. Rehana and Irum (2012) discussed the success of Islamic banks in Pakistan as well as the challenges they confront. Based on their data, the authors came to the conclusion that Islamic banks had high asset quality and adequate capital compared to Islamic branches of conventional banks and conventional banks. The performance indicators of Islamic banking in Pakistan are distinct from those found in similar research studies undertaken in other parts of the world. Baral (2005) emphasised that the financial stability of joint venture banks is just fair and insufficient to withstand possibly significant shocks to their balance sheet. The analysis in this study is solely built upon the CAMELS framework. According to the report, public sector banks must continue to satisfy the NRB’s capital sufficiency standards. In their study, Mishra et al. (2012) looked at the diverse aspects of convergence and soundness in the Indian banking sector. The banks in the private sector were found to perform the best in terms of soundness at the top of the ranking. Public sector banks such as Union Bank and SBI, in contrast, have lagged and have weak economic soundness. The CAMEL model was used by Siti and Hafiza (2015) to evaluate the efficiency of the Malaysian banking sector. It was recommended that Malaysian banks should enhance their business acumen by reducing interest rates. They must regularly monitor the financial health and capability of borrowers in order to lower the risk of non-performing loans. State Bank of India needs to improve the quality of its assets, the efficiency of its management and its liquidity, assert Jaspreet et al. (2015). Punjab National Bank has to improve its liquidity and asset quality. Bank of India should focus on capital adequacy and earning quality. According to the study’s results, Bank of Baroda is the market leader in each CAMEL component, followed by Punjab National Bank in terms of capital adequacy, managerial efficiency and earning capacity, and Bank of India in terms of asset quality. Sangmi et al. (2010) attempted to evaluate the financial health of the two main banks operating in northern India in their article. This study was carried out using the most recent financial analysis model, CAMEL parameters. This model shows that the studied banks’ situations are strong and adequate in terms of capital adequacy, asset quality, management competence and liquidity. As a result, it is important to keep the right balance between liquid and non-liquid assets. No one CAMEL factor, according to Dzeawuni and Tanko (2008), is sufficient to accurately represent a bank’s total performance. The regulators of banks are urged, among other things, to evaluate bank performance using the best recognised ratios from CAMEL. The results of the Mihir and Annyesha (2009) study showed that, for the majority of the CAMELS variables, private and foreign banks performed better than public sector banks over the study period. If public sector banks want to compete with private/foreign banks, the study’s findings indicate that they must swiftly adapt to changing market conditions. Golam (2014) attempted to evaluate the financial standing of the two biggest banks doing business in Bangladesh in this study. This evaluation has been carried out using CAMEL parameters. Regarding their liquidity, asset quality, managerial capability and capital sufficiency, it is underlined that the banks included in the analysis are in a sound and adequate position. Echekoba et al. (2014) used CAMEL to conduct research to evaluate the profitability of Nigerian banks. It was found that while liquidity had a significant impact on bank profitability in Nigeria, capital sufficiency, asset quality, management effectiveness and earnings had minimal effects.
Methodology
Sample of the Study
Considering the contribution made by banks in changing the economic outlook in India, particularly with regard to lending, deposits, employment of employees, branch network and other factors. The researcher has chosen one bank from the public and private sectors for the investigation.
Public sector bank: State Bank of India
Private sector bank: Industrial Credit and Investment Corporation of India bank.
Profile of Public and Private Sector Banks
Public sector bank: State Bank of India (SBI) accounts for 23% of all market assets in the country. It is India’s largest public sector bank, with a market value of almost 3.7 trillion Indian rupees as of June 2021. It maintains the largest branch network in the world while providing a wide range of financial products to its clients. In addition to having over 50 branch offices in 30 different countries, SBI also has seven foreign subsidiaries in the US, Canada, Nepal, Bhutan, Nigeria, Mauritius and the UK. The Indian government has included SBI in its goals for developing the country’s infrastructure, agriculture and industry; but, since competition was brought into the country’s commercial banking sector, SBI has been obliged to reform its operations. On the Fortune Global 500 list of the biggest businesses in the world in 2021, the State Bank of India was ranked number 221. Additionally, it was recognised as India’s largest bank and twice as the Best Transaction Bank in India by ‘The Asian Banker’.
Private sector bank: When speaking of the largest private sector bank in India in terms of total assets, the name of Industrial Credit and Investment Corporation of India (ICICI) bank quickly comes to mind. It is India’s largest private sector bank, with a market value of almost 4.5 trillion Indian rupees as of June 2021. In terms of assets and market capitalisation, ICICI Bank is the second-largest private sector bank in the country. In India now, ICICI Bank operates a network of 14,040 ATMs and 5,288 branches. It has brand recognition in 17 different countries. In addition to having branches in the USA, China, South Africa, Bahrain, Singapore, Qatar, Hong Kong and Oman, it also has subsidiaries in the UK and Canada. Additionally, it has affiliates in Canada and the UK. Other nations where ICICI Bank keeps representative offices include Bangladesh, Malaysia, Indonesia and the United Arab Emirates. Its UK subsidiary has branches in Belgium and Germany.
Study Period
The most of the study’s secondary data come from SBI and ICICI Bank annual reports, which cover the five fiscal years ending on 31 March 2017 to 31 March 2021.
Tool Adopted in this Research
The research instrument used in the current study is the CAMELS model, which uses a number of ratios and is recognised as a key model in the area of assessing the financial performance of banks. The statistical tool known as the t-test is also used for further analysis and hypothesis testing.
Statement of Hypotheses
H1: There is no significant difference in capital adequacy of public and private sector banks.
H2: There is no significant difference in asset quality of public and private sector bank.
H3: There is no significant difference in management efficiency of public and private sector bank.
H4: There is no significant difference in earning quality of public and private sector bank.
H5: There is no significant difference in liquidity of public and private sector bank.
CAMEL Parameters
Since 1995, the Executive Director of Reserve Bank of India, Mr. Padmanabhan, has recommended using CAMEL parameters in India. This method rates banks based on five crucial factors: capital sufficiency, asset quality, managerial ability, earning potential and liquidity.
Figure 1. CAMEL Parameters.
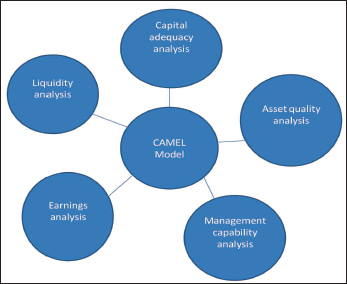
Capital adequacy analysis: A measure of capital sufficiency is the ratio of capital to risk-weighted assets. Trust among depositors in the bank is increased by a high capital adequacy ratio. The amount of capital a bank reflects its internal tenacity, which would be useful in times of crisis. The Reserve Bank of India (RBI) issued a directive in 1992 mandating all Indian banks to abide by the capital adequacy criterion of 9%, which was set based on the recommendations of the Basel Committee, in recognition of the importance of capital adequacy. Maintaining the confidence of its depositors and avoiding insolvency are essential for a bank. Their capital sufficiency reflects both the banks’ overall financial health and management’s ability to issue additional capital. It demonstrates the bank's ability to handle unforeseen losses with capital as well. Leverage among banks is shown by the capital adequacy ratio.
Assets quality analysis: It takes into consideration the proportion of bank loans that are NPAs (non-performing assets). A greater NPA suggests that the quality of the loans supplied to banks is weaker, which is bad for the bank. Another crucial factor in determining a bank’s success under the Reserve Bank of India’s rules is asset quality, which is the standard of its advances.
Management efficiency ratios: Management effectiveness is a key component of the CAMEL model that ensures a bank’s survival and growth. The ratios in this sector account for subjective evaluations and managerial performance. The management of the bank makes crucial decisions based on how they view the risk.
Earnings quality ratios: An institution’s profitability is a direct reflection of the reliability and calibre of its earnings. In essence, it determines how profitable the bank is. Additionally, it covers how future earnings growth will be sustainable. This trait has greater significance in light of the assertion that non-core activities including investments, treasury operations and corporate consultancy services account for a sizable amount of a bank’s revenue.
Liquidity ratios: Liquidity is essential for any organisation that deals with money. Liquidity, which measures a bank’s ability to meet its financial obligations. For a bank, maintaining the right level of liquidity is essential because doing otherwise would lead to lower profitability. Banks must be sufficiently cautious while hedging liquidity risk and make sure that a sizeable amount of funds are invested in higher return-generating projects in order to generate profit while also providing liquidity to depositors.
In addition to above, sensitivity is one more parameter help to measures an institution’s sensitivity to market risks. Sensitivity reflects the degree to which earnings are affected by interest rates, exchange rates and commodity prices, all of which can be expressed by beta factor.
Results
Table 1 and Table 2 present the capital adequacy ratios of SBI and ICICI Bank. The mean of capital adequacy ratio of the SBI is 13.09% while ICICI Bank records 17.59%. Both banks have kept their capital adequacy ratios above the minimum standards set by Basel II and Basel III.
Table 1. Capital Adequacy Ratios of SBI.
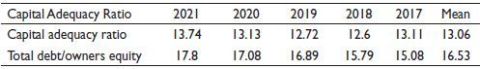
Source: Compiled from the annual reports of SBI.
Table 2. Capital Adequacy Ratios of ICICI Bank.
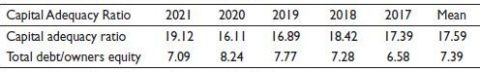
Source: Compiled from the annual reports of ICICI Bank.
Table 3. Assets Quality Ratios of SBI.
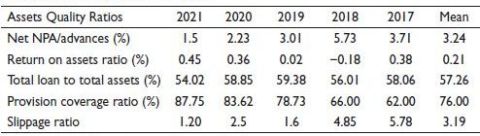
Source: Compiled from the annual reports of SBI.
Table 4. Assets Quality Ratios of ICICI Bank.
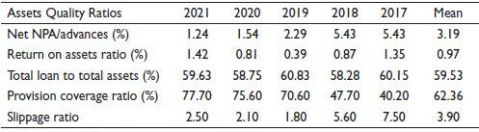
Source: Compiled from the annual reports of ICICI Bank.
The ratio of total debt to owners’ equity can be used to determine how much debt is being used to finance its assets. The average debt-to-equity ratio of SBI is larger than that of ICICI Bank. It is 7.39% in the case of ICICI Bank and 16.53% in the case of SBI.
Table 3 and Table 4 provide the asset quality ratios for SBI and ICICI Bank, respectively. The ratio of net NPA to net advances provides information about the bank’s asset quality. The average ratio for both institutions exceeds 3%.
Table 5. Management Efficiency Ratios of SBI.
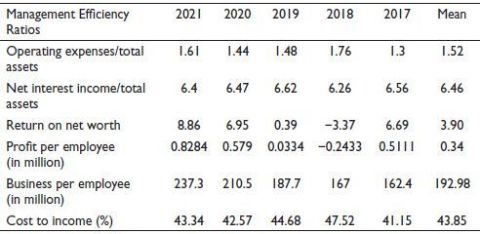
Source: Compiled from the annual reports of SBI.
Table 6. Management Efficiency Ratios of ICICI Bank.
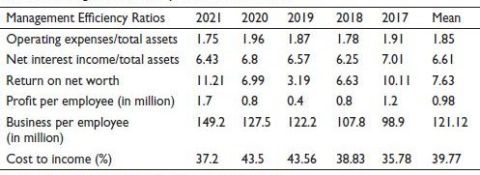
Source: Compiled from the annual reports of ICICI Bank.
The mean return on asset ratios for SBI and ICICI Bank are 0.21% and 0.97%, respectively. The ratio of total loans to total assets calculates the proportion of total assets taken up by outstanding loans. The average ratio of ICICI Bank’s total loans to total assets is higher than SBI’s. The mean of provision coverage ratio shows that the SBI has maintained 76% which is good when compared with 62.36% of ICICI Bank. The average of slippage ratio is 3.19 of SBI and 3.90 recorded by ICICI Bank.
The management efficiency ratios of SBI and ICICI Bank are shown in Table 5 and Table 6, respectively. SBI and ICICI Bank have average operating expenses to total assets ratios of 1.52% and 1.85%, respectively. The net income earned on assets that generate income is explained by the ratio of net interest income to total assets. Both banks made an effort to keep the ratio of net interest revenue to total assets at or above 6%. SBI’s mean return on net worth ratio is 3.90%, whereas ICICI Bank’s is 7.63%.
Table 7. Earnings Quality Ratios of SBI.
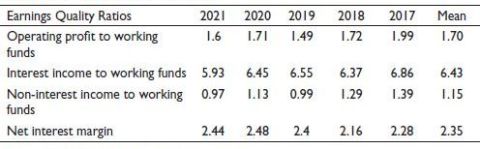
Source: Compiled from the annual reports of SBI.
Profit per employee expressed in million shows how well management generates profits; SBI and ICICI Bank have very different average profit per employee figures.
The amounts are 0.34 million and 0.98 million, respectively, from SBI and ICICI Bank. However, SBI has a greater mean of volume of business per employee than ICICI Bank. SBI and ICICI Bank, respectively, reported 192.98 million and 121.12 million. SBI displays a mean of cost-to-income ratio of 43.85%, whereas ICICI kept it at 39.77%. Table 7 and Table 8 exhibit the information concerning earning quality ratios of SBI and ICICI Banks.
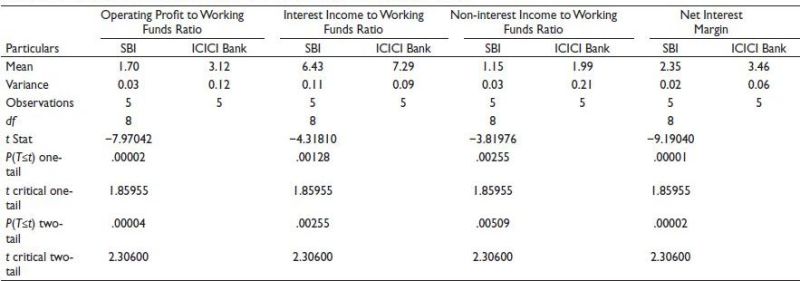
A number of ratios were used to assess the earning quality of a bank. The ratio of operational profit to working capital reflects the bank’s profitability at the operating level. SBI’s average operating profit to working capital ratio is 1.70%, whereas ICICI Bank reported a 3.12% ratio. In comparison to SBI, the mean of interest income to working capital ratio is higher at ICICI Bank by 0.86%. The ratio of non-interest revenue to working capital represents the revenue the bank receives from other sources, namely commission, brokerage and gains from asset revaluations; however, core income from interest in the form of NII is almost the same for both banks in the relevant period. The difference between interest received on loans and interest paid on deposits is shown by the net interest margin ratio. The average net interest margin ratio between ICICI Banks and SBI differs by 1.11.
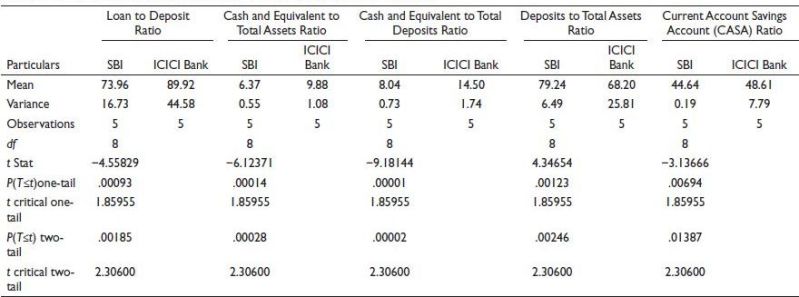
Table 9 and Table 10 present data on SBI and ICICI Bank’s liquidity ratios. SBI shows a mean of loan-to-deposit ratio 73.96%, whereas ICICI Bank displays 89.92%. The average cash and equivalent to total assets ratio for SBI and ICICI Bank, respectively, is 6.37% and 9.88%. The average cash and equivalent to total deposit ratio for ICICI Bank is 6.46% higher than that of SBI. The mean of deposit-to-total asset ratio for SBI and ICICI Banks is 79.24% and 68.0%, respectively. Comparison between mean of CASA ratio of SBI is 44.64% while ICIC Bank depicts 48.61%.
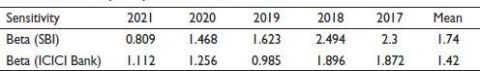
Table 11 depicts sensitivity of SBI and ICICI Bank through mean of beta of SBI is 1.74 while ICICI Bank records 1.42.
Table 8. Earnings Quality Ratios of ICICI Bank.
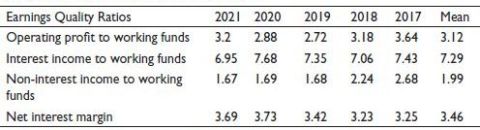
Source: Compiled from the annual reports of ICICI Bank.
Table 9. Liquidity Ratios of SBI.
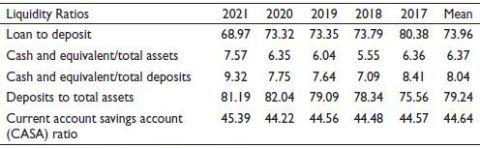
Source: Compiled from the annual reports of SBI.
Table 10. Liquidity Ratios of ICICI Bank.
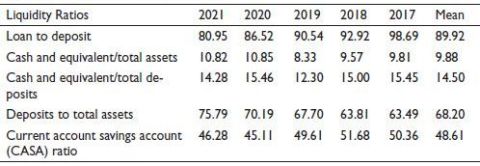
Source: Compiled from the annual reports of ICICI Bank.
Table 11. Sensitivity Analysis of SBI and ICICI Bank.
Hypothesis Testing
H1: There is no significant difference in capital adequacy of public and private sector banks.
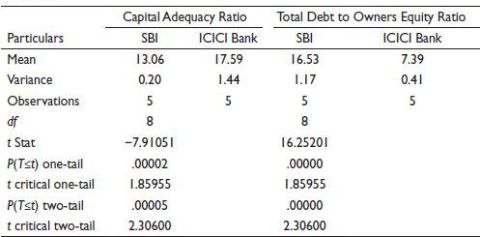
Table 12 displays the findings of a t-test examination of the capital adequacy ratios of SBI and ICICI Banks. The capital adequacy ratio has a t-statistic value of −7.91051, but the crucial t value is less. It indicates the capital adequacy ratios of SBI and ICICI Bank differ significantly. The t-statistic for the total debt to owner equity ratio is 16.25201, which is lower than the t-statistic value. It shows significant difference between SBI and ICICI Bank’s total debt to owner equity ratio. Thus, t-test results at the 5% level of significance shows that the null hypothesis is rejected and the alternative hypothesis is accepted.
Table 12. Analysis of Capital Adequacy Ratios t-Test: Two-sample Assuming Equal Variances.
H2: There is no significant difference in asset quality of public and private sector bank.
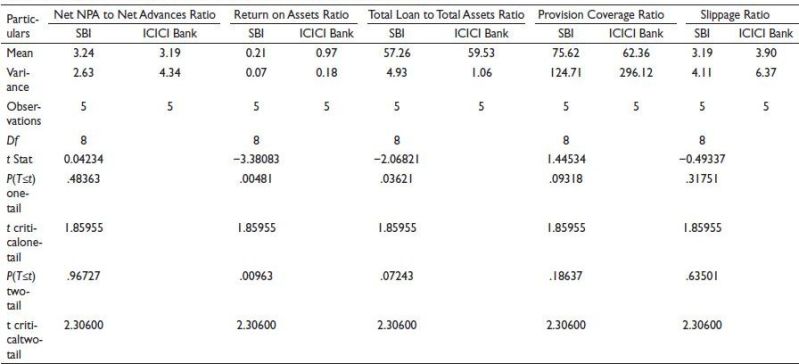
In Table 13, an analysis of asset quality ratio is shown. It demonstrates that the t value, statistic’s which is smaller than the crucial value, is 0.04234. It shows there is no significant difference between SBI and ICICI Bank’s net NPA to net advances ratio.
The return on asset ratio’s t-statistic value is ≤3.38083, is higher than the threshold t value, and indicates return on asset ratios of SBI and ICICI Bank differ significantly. While in case of total loan to total asset ratio, provision coverage ratio and slippage ratio the calculated t value is less than critical value of t. As a result, at the 5% level of significance the null hypothesis is accepted in cases when four ratios reflect the asset quality, with the exception of the return on asset ratio and the alternative hypothesis is rejected. Therefore, there is no significant difference in the asset quality of public and private sector banks.
H3: There is no significant difference in management efficiency of public and private sector bank.
Table 14a demonstrates the t-test outcome for management efficiency ratios. The t-statistic value is greater than the t-critical threshold, shows operating expenses to total asset ratio of SBI and ICICI Bank differs significantly. The t-statistic value for net interest income to total asset ratio and return on net worth ratio, is below the crucial value. As a result, it can be concluded that there is no significant difference between SBI and ICICI Bank’s net interest income to total asset ratio and return on net worth ratio.
Table 13. Analysis of Asset Quality Ratios t-Test: Two-sample Assuming Equal Variances.
It is clear from Table 14b that the p value is higher than the alpha level: p >.05. It can be claimed that there is no appreciable difference between SBI and ICICI Bank’s profit per employee. The difference between the business per employee of SBI and ICICI Bank is indicated as the business per employee p value is smaller than the alpha level. SBI and ICICI Bank’s cost-to-income ratios show no difference because their p values are higher than their alpha levels.
Out of six, three ratios show a significant difference between SBI and ICICI Bank’s managerial effectiveness. Like the cost-to-income ratio, business per employee and the operational expense to total asset ratio. While the ratio of net interest revenue to total assets, return on net worth and profit per employee all indicate that there is no appreciable difference between public and private sector banks in terms of management effectiveness.
H4: There is no significant difference in earning quality of public and private sector bank.
The examination of the earning quality ratios for SBI and ICICI Banks is shown in Table 15. The operational profit to working funds ratio of both banks differs significantly, as indicated by the t-statistic value being more than the critical value of t.
The t-test indicates a significant difference between the interest income to working funds ratios of the SBI and ICICI Banks because the t-statistic value is greater than the critical value of t. Because the crucial value of t is less than the t-statistic value, the ratio of non-interest revenue to working capital differs significantly between SBI and ICICI Banks. At an alpha level of .05 the estimated t-value exceeds the table value. The p-value is less than the alpha level: p < .05. The alpha level is less than the p value. Therefore, it is possible to conclude that SBI and ICICI Banks’ net interest margins differ from one another.
Thus, it may be concluded from the study of numerous ratios relating to earning quality that, at a 5% level of significance, the null hypothesis is rejected and the alternative hypothesis is accepted. The earning quality of public and private sector banks differs significantly.
H5: There is no significant difference in liquidity of public and private sector bank.
At an alpha level of .05 the estimated t-value exceeds the table value. The p-value is less than the alpha level: p < .05. Table 16 presents the results of the SBI and ICICI Bank’s liquidity ratio t tests. The t-statistic value is greater than the t-critical value. It shows that the loan to deposit ratios of both banks differ significantly. The t-statistic value of cash and equivalent to total assets ratio and cash and equivalent to total deposit ratio is higher than the crucial value of t. It indicates that SBI and ICICI Bank have significantly different cash and equivalent to total assets ratio and cash and equivalent to total deposit ratio.
Table 14a. Analysis of Management Efficiency Ratios t-Test: Two-sample Assuming Equal Variances.
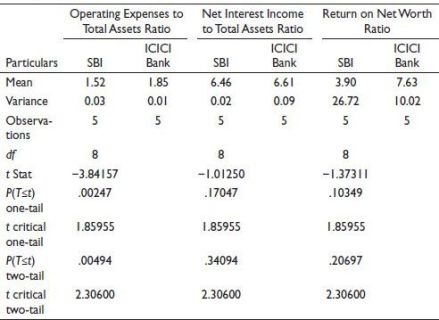
Table 14b. Analysis of Management Efficiency Ratios t-Test: Two-sample Assuming Equal Variances.
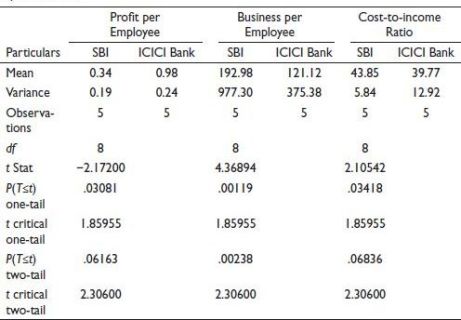
Table 15. Analysis of Earnings Quality Ratios t-Test: Two-sample Assuming Equal Variances.
At an alpha level of .05 the estimated t value exceeds the table value. The p value is .05. The alpha level is less than the p value. Therefore, it may be concluded that the deposit-to-total asset ratios of SBI and ICICI Banks differ. Thus, it may be concluded that the alternative hypothesis is accepted at a 5% level of significance and the null hypothesis is rejected. The liquidity of banks in the public and private sectors differs significantly.
Discussion
According to the analysis, banks in both the public and private sectors are financially viable due to the adoption of responsible money management practices. Both banks have kept their capital adequacy ratios substantially over Basel III’s 9% minimum requirement. In comparison to ICICI Bank, the SBI uses debt to finance more of its assets. Asset quality ratios show that the SBI and ICICI Banks’ asset quality is good. When compared to SBI, the ICICI Bank continuously works to reduce its NPA relative to advances, and the return on asset ratio is important since it shows how efficiently assets are being used. While speaking about provision coverage ratio and slippage ratio both the banks tried to improve it consistently during study period.
The management efficiency ratio shows how effectively management makes choices and runs the company, which either directly or indirectly aids in the expansion of the bank. Nearly all ratios assessed for both banks, with the exception of business per employee, show progress; however, ratios for ICICI Bank demonstrate higher managerial efficiency when compared to SBI during the study period. A number of ratios, including interest income to total income, return on asset, operating profit to working capital, interest income to working capital, non-interest income to working capital and net interest margin, are used to evaluate the earning quality of SBI and ICICI Banks. All the ratios indicate that, when compared to SBI, ICICI Bank reported good earning quality.
According to liquidity ratios, ICICI Bank’s short-term liquidity position is better than SBI’s. While deposits and investments in government securities as a percentage of total assets are higher for SBI than ICICI.
Further evidence from the hypothesis testing shows that there are significant differences between SBI and ICICI Bank in terms of capital sufficiency, earning quality and liquidity. Some ratios, such as operating expenses to total assets, business per employee and cost-to-income ratio, show a significant variation in management efficiency; however, other parts of management efficiency ratios show no such difference between SBI and ICICI Bank.
Asset quality ratios show no appreciable variation between SBI and ICICI’s assets.
Statistical tools employed for analysis with the available data demonstrate reasonable conclusions for the better performances of ICICI Bank on various scores.
Table 16. Analysis of Liquidity Ratios t-Test: Two-sample Assuming Equal Variances.
Conclusion
According to the study’s findings, when employing the CAMELS model to compare financial performance between private and public sector banks, the former performs better.
Declaration of Conflicting Interests
The author declared no potential conflicts of interest with respect to the research, authorship and/or publication of this article.
Funding
The author received no financial support for the research, authorship and/or publication of this article.
ORCID iD
Manisha Vikas Jagtap https://orcid.org/0000-0003-4546-5437
Angela, R., & Alina, C. S. (2013). Analyzing the financial soundness of the commercial banks in Romania: An approach based on the CAMELS framework. Procedia Economics and Finance, 6(2013), 703–712. https://doi.org/10.1016/S2212-5671(13)00192-5
Baral, K. J. (2005). Health check-up of commercial banks in the framework of CAMEL: A case study of joint venture banks in Nepal. The Journal of Nepalese Business Studies, 2(1), 41–55. https://doi.org/10.3126/jnbs.v2i1.55
Dincer, H., Gulsah, G., Nazife, O., & Kevser, S. (2011). A performance evaluation of the Turkish banking sector. Procedia Social and Behavioral Sciences, 24,1530–1545. https://doi.org/10.1016/j.sbspro.2011.09.051
Dzeawuni, W. A., & Tanko, M. (2008). CAMELs and banks performance evaluation: The way forward. SSRN, 1–21. https://dx.doi.org/10.2139/ssrn.1150968
Echekoba, F. E., Egbunike, C. F., & Ezu, G. K. (2014). Determinants of bank profitability in Nigeria: Using CAMEL rating model. IOSR Journal of Business and Management, 16(9), 44–50.
Golam, M. (2014). Use of CAMEL model: A study on financial performance of selected commercial banks in Bangladesh. Universal Journal of Accounting and Finance, 2(5), 151–161. https://doi.org/10.13189/ujaf.2014.020504
Jaspreet, K., Manpreet, K., & Simranjit, S. (2015). Financial performance analysis of selected public sector banks: A CAMEL model approach. IJABER, 13(6), 4327–4348. https://www.researchgate.net/publication/301681152
Mihir, D., & Annyesha, D. (2009). A CAMELs analysis of the Indian banking industry. SSRN, 1–10. http://dx.doi.org/10.2139/ssrn.1666900
Mishra, A. K., Harsha, G. S., Shivi, A., & Neil, R. D. (2012). Analyzing soundness in Indian banking: A CAMEL approach. Research Journal of Management Sciences, 1(3), 9–14. http://isca.in/IJMS/Archive/v1/i3/2.ISCA-RJMS-2012-028.pdf
Mishra, S. K., & Aspal, P. K. (2012). A CAMEL model analysis of state bank group. Proceedings of 19th International Business Research Conference 2012. https://ssrn.com/abstract=2177099
Muhammet, M., Arnold, R., Reha, Y., & Ahmet, B. E. (2003). The effect of scale and mode of ownership on the financial performance of the Turkish banking sector: Results of a DEA-based analysis. Socio-economic Planning Sciences, 37(2003), 185–202.
Rehana, K., & Irum, S. (2012). Gauging the financial performance of banking sector using CAMEL model: Comparison of conventional, mixed and pure Islamic banks in Pakistan. International Research Journal of Finance and Economics, 82(2012), 68–88.
Sangmi, M. & Nazir, T. (2010). Analyzing financial performance of commercial banks in India: Application of CAMEL model. Pakistan Journal of Commerce and Social Sciences, 4(1), 40–55. https://www.econstor.eu/handle/10419/187999
Siti, N. M., & Hafiza, A. H. (2015). Using the CAMEL framework in assessing bank performance in Malaysia. International Journal of Economics, Management and Accounting, 23(1), 109–127. https://www.researchgate.net/publication/279200285
